I was just thinking this morning that it’s been a while since I posted anything in my Bad Statistics folder when suddenly I come across this gem from a paper in Nature Astronomy entitled Could quantum gravity slow down neutrinos?
The paper itself is behind a paywall (though a preprint version is on the arXiv here). The results in the paper were deemed so important that Nature Astronomy tweeted about them, including this remarkable graph:

Understandably there has been quite a lot of reaction from scientists on Twitter to this plot, questioning how the blue line is obtained from the dots (as only one point to the right appears to be responsible for the trend), remarking on the complete absence of any error bars on either axis for any of the points, and above all wondering how this managed to get past a referee, never mind one for a “prestigious” journal such as Nature Astronomy. It wouldn’t have passed muster as an undergraduate exercise.
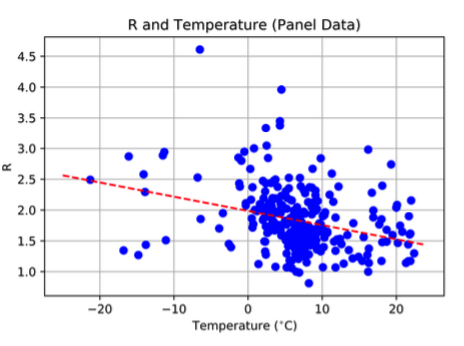
Of course this is how a proper astronomer would do it:
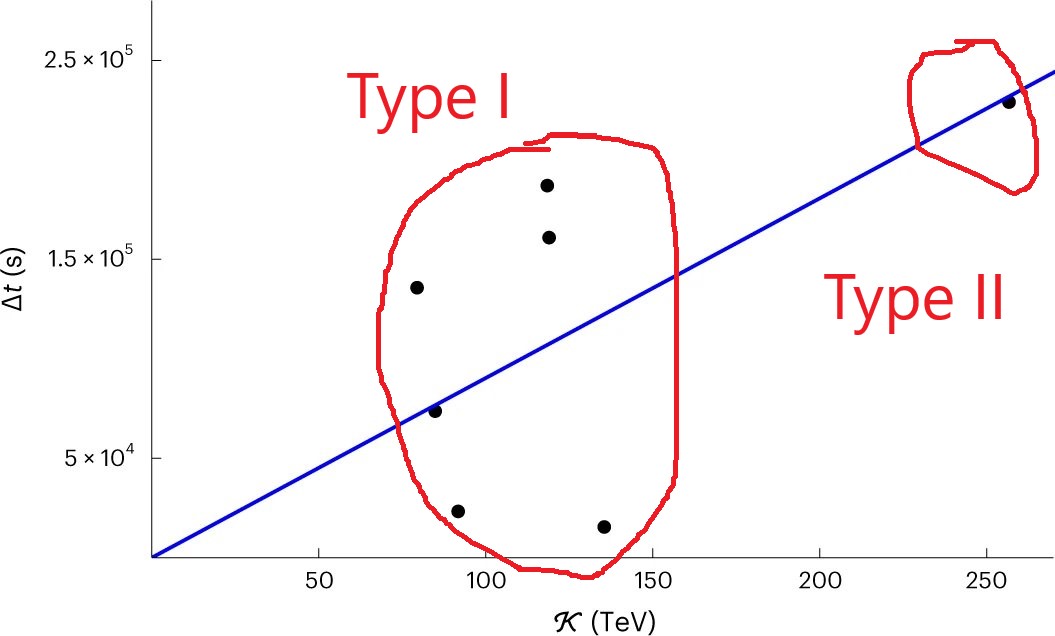
Joking aside, if you look at the paper (or the preprint if you can’t afford it) you will see another graph, which shows two other points at higher energy (red triangles):

The extra two points don’t have any error-bars either, and according to the preprint these appear to be unconfirmed candidate GRB events.
The abstract of the paper is:
In addition to its implications for astrophysics, the hunt for neutrinos originating from gamma-ray bursts could also be significant in quantum-gravity research, as they are excellent probes of the microscopic fabric of spacetime. Some previous studies based on neutrinos observed by the IceCube observatory found intriguing preliminary evidence that some of them might be gamma-ray burst neutrinos whose travel times are affected by quantum properties of spacetime that would slow down some of the neutrinos while speeding up others. The IceCube collaboration recently significantly revised the estimates of the direction of observation of their neutrinos, and we here investigate how the corrected directional information affects the results of the previous quantum-spacetime-inspired analyses. We find that there is now little evidence for neutrinos being sped up by quantum spacetime properties, whereas the evidence for neutrinos being slowed down by quantum spacetime is even stronger than previously determined. Our most conservative estimates find a false-alarm probability of less than 1% for these ‘slow neutrinos’, providing motivation for future studies on larger data samples.
I agree with the last sentence where it says larger data samples are needed in future, but also I’d suggest higher standards of data analysis are also called for. Not to mention refereeing. After all, it’s the quality of the reviewing that you pay for, isn’t it?
P.S. For those of you wondering, this paper would not have been published by the Open Journal of Astrophysics even if passed review, as it is not on the astro-ph section of arXiv (it’s on gr-qc).