I thought I’d take a short break from doing absolutely nothing to post a quick little item about gravitational lensing. It’s been in my mind to say something about this since I mentioned it in one of the lectures I gave just before Christmas, but I’ve been too busy (actually too disorganized) to do it until now. It’s all based on a paper posted to the arXiv in December which was led by Jo Woodward (née Short) who did her PhD with me in Cardiff and is now in a postdoctoral research position in Durham (which is in the Midlands). The following pictures were take from her paper.
This figure shows the geometry of a gravitational lens system: light from the source S is deflected by the gravitational potential of the lens L so that an image I appears at a position on the sky which is different from the actual position when viewed by the observer O:
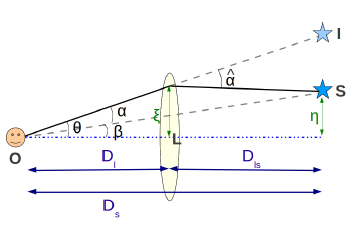
There’s a critical radius (which depends on the mass and density profile of the lens) at which this can lead to the formation of multiple images of the source. Even if multiple images are not resolved, lensing results in an increase in the apparent brightness of the source.
A great deal of cosmological information can be gleaned statistically from lensing with even limited knowledge of the properties of the source and lens populations and with incomplete information about e.g. the actual angular deflection produced by the lens or the lens mass. To illustrate this, just consider the expression for the differential optical depth to lensing (related to the probability that a source at redshift  is lensed by an object at redshift

The first two terms are cosmological, accounting geometrical and expansion effects. Roughly speaking, the larger the volume out to a given redshift the higher the probability is that a given source will be lensed. The third term involves the mass function of lens systems. In the framework of the standard cosmological model this can be computed using Press-Schechter theory or one of the variations thereof. According to current understanding, cosmological structures (i.e. galaxies and clusters of galaxies) form hierarchically so this mass function changes with redshift, with fewer high mass objects present at high redshift than at low redshift, as represented in this picture, in which masses are given in units of solar masses, the colour-coding representing different redshifts:

The last term represents the lensing cross-section of an object with a given mass. This depends on the internal structure of the lens – an object in which the mass is highly concentrated produces lensing effects radically different from one that isn’t. Two simple models for the mass distribution are the singular isothermal sphere (SIS) and the Navarro-Frenk-White profile (NFW). The latter is thought (by some) to represent the distribution of cold dark matter in haloes around galaxies and clusters which is more diffuse than that of the baryonic material because it can’t dissipate energy which it needs to do to fall into the centre of the object. The real potential of a galaxy in its central regions could be more like the SIS profile would predict, however, because baryons outweigh dark matter there.
Now time for a bit of historical reminiscence. In 1997 I published a book with George Ellis in which we analysed the evidence available at the time relating to the density of matter in the Universe. It was a little bit controversial at the time, but it turns out we were correct in concluding that the density of matter was well below the level favoured by most theorists i.e. only about 20-30% of the critical density. However we did not find any compelling evidence at that time for a cosmological constant (or, if you prefer, dark energy). Indeed one of the strongest upper limits on the cosmological constant came from gravitational lensing measurements, or rather the dearth of them.
The reason for this negative conclusion was that, for a fixed value of the Hubble constant, in the presence of a cosmological constant the volume out to a given redshift is much larger than if there is no cosmological constant. That means the above integral predicts a high probability for lensing. Surveys however failed to turn up large numbers of strongly-lensed objects, hence the inference that the universe could not be dominated by a cosmological constant. This is, of course, assuming that the other terms in the integral are well understood and that the reason significant numbers of lensed systems weren’t found wasn’t just they are tricky to identify…
Meanwhile, huge advances were made in other aspects of observational cosmology that established a standard cosmological model in which the cosmological constant makes up almost 75% of the energy budget of the Universe.
Now, 15 years later on, enter the Herschel Space Observatory, which turns out to be superb at identifying gravitational lenses. I posted about this here, in fact. Working in the far-infrared makes it impossible to resolve multiple images with Herschel – even with a 3.5m mirror in space, λ/D isn’t great for wavelengths of 500 microns! However, the vast majority of sources found during the Herschel ATLAS survey with large fluxes at this wavelengths can be identified as lenses simply because their brightness tells us they’ve probably been magnified by a lens. Candidates can then be followed up with other telescopes on the ground. A quick look during the Science Demonstration Phase of Herschel produced the first crop of firmly identified gravitational lens systems published in Science by Negrello et al.. When the full data set has been analysed there should be hundreds of such systems, which will revolutionize this field.
To see the potential (no pun intended) of this kind of measurement, take a look at these five systems from the SDP set:

These systems have measured (or estimated) source and lens redshifts. What is plotted is the conditional probability of a lens at some particular lens redshift, given the source redshift and the fact that strong lensing has occurred. Curves are given for SIS and NFW lens profiles and everything else is calculated according to the standard cosmological model. The green bars represent the measured lens redshifts. It’s early days, so there are only five systems, but you can already see that they are pointing towards low lens redshifts, favouring NFW over SIS; the yellow and light blue shading represents regions in which 68% of the likelihood lies. These data don’t strongly prefer one model over the other, but with hundreds more, and extra information about at least some of the lens systems (such as detailed determinations of the lens mass from deflections etc) we should be able to form more definite conclusions.
Unfortunately the proposal I submitted to STFC to develop a more detailed theoretical model and statistical analysis pipeline (Bayesian, of course) wasn’t funded. C’est la vie. That probably just means that someone smarter and quicker than me will do the necessary…


