Interesting press release today from the Royal Astronomical Society about a paper (preprint version here) which casts doubt on whether the Wilkinson Microwave Anisotropy Probe supports the standard cosmological model to the extent that is generally claimed. Apologies if this is a bit more technical than my usual posts (but I like occasionally to pretend that it’s a science blog).
The abstract of the paper (by Sawangwit & Shanks) reads
Using the published WMAP 5-year data, we first show how sensitive the WMAP power spectra are to the form of the WMAP beam. It is well known that the beam profile derived from observations of Jupiter is non-Gaussian and indeed extends, in the W band for example, well beyond its 12.’6 FWHM core out to more than 1 degree in radius. This means that even though the core width corresponds to wavenumber l ~ 1800, the form of the beam still significantly affects the WMAP results even at l~200 which is the scale of the first acoustic peak. The difference between the beam convolved Cl; and the final Cl is ~ 70% at the scale of the first peak, rising to ~ 400% at the scale of the second. New estimates of the Q, V and W-band beam profiles are then presented, based on a stacking analysis of the WMAP5 radio source catalogue and temperature maps. The radio sources show a significantly (3-4σ) broader beam profile on scales of 10′-30′ than that found by the WMAP team whose beam analysis is based on measurements of Jupiter. Beyond these scales the beam profiles from the radio sources are too noisy to give useful information. Furthermore, we find tentative evidence for a non-linear relation between WMAP and ATCA/IRAM 95 GHz source fluxes. We discuss whether the wide beam profiles could be caused either by radio source extension or clustering and find that neither explanation is likely. We also argue against the possibility that Eddington bias is affecting our results. The reasons for the difference between the radio source and the Jupiter beam profiles are therefore still unclear. If the radio source profiles were then used to define the WMAP beam, there could be a significant change in the amplitude and position of even the first acoustic peak. It is therefore important to identify the reasons for the differences between these two beam profile estimates.
The press release puts it somewhat more dramatically
New research by astronomers in the Physics Department at Durham University suggests that the conventional wisdom about the content of the Universe may be wrong. Graduate student Utane Sawangwit and Professor Tom Shanks looked at observations from the Wilkinson Microwave Anisotropy Probe (WMAP) satellite to study the remnant heat from the Big Bang. The two scientists find evidence that the errors in its data may be much larger than previously thought, which in turn makes the standard model of the Universe open to question. The team publish their results in a letter to the journal Monthly Notices of the Royal Astronomical Society.
I dare say the WMAP team will respond in due course, but this paper spurred me to mention some work on this topic that was done by my friend (and former student) Lung-Yih Chiang. During his last visit to Cardiff we discussed this at great length and got very excited at one point when we thought we had discovered an error along the lines that the present paper claims. However, looking more carefully into it we decided that this wasn’t the case and we abandoned our plans to publish a paper on it.
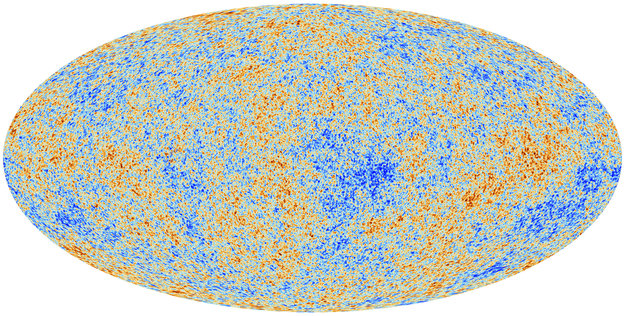
Let me show you a few slides from a presentation that Lung-Yih gave to me a while ago. For a start here is the famous power-spectrum of the temperature fluctuations of the cosmic microwave background which plays an essential role in determining the parameters of the standard cosmology:

The position of the so-called “acoustic peak” plays an important role in determining the overall curvature of space-time on cosmological scales and the higher-order peaks pin down other parameters. However, it must be remembered that WMAP doesn’t just observe the cosmic microwave background. The signal it receives is heavily polluted by contamination from within our Galaxy and there is also significant instrumental noise. To deal with this problem, the WMAP team exploit the five different frequency channels with which the probe is equipped, as shown in the picture below.

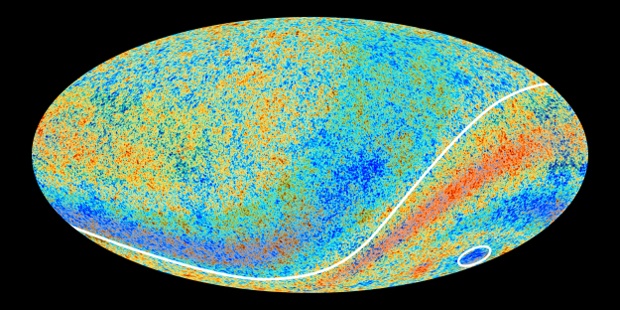
The CMB, being described by a black-body spectrum, has a sky temperature that doesn’t vary with frequency. Foreground emission, on the other hand, has an effective temperature that varies with frequency in way that is fairly well understood. The five available channels can therefore be used to model and subtract the foreground contribution to the overall signal. However, the different channels have different angular resolution (because they correspond to different wavelengths of radiation). Here are some sample patches of sky illustrating this

At each frequency the sky is blurred out by the “beam” of the WMAP optical system; the blurring is worse at low frequencies than at high frequencies. In order to do the foreground subtraction, the WMAP team therefore smooth all the frequency maps to have the same resolution, i.e. so the net effect of optical resolution and artificial smoothing produces the same overall blurring (actually 1 degree). This requires accurate knowledge of the precise form of the beam response of the experiment to do it accurately. A rough example (for illustration only) is given in the caption above.
Now, here are the power spectra of the maps in each frequency channel

Note this is Cl not l(l+1)Cl as in the first plot of the spectrum. Now you see how much foreground there is in the data: the curves would lie on top of each other if the signal were pure CMB, i.e. if it did not vary with frequency. The equation at the bottom basically just says that the overall spectrum is a smoothed version of the CMB plus the foregrounds plus noise. Note, crucially, that the smoothing suppresses the interesting high-l wiggles.
I haven’t got space-time enough to go into how the foreground subtraction is carried out, but once it is done it is necessary to “unblur” the maps in order to see the structure at small angular scales, i.e. at large spherical harmonic numbers l. The initial process of convolving the sky pattern with a filter corresponds to multiplying the power-spectrum with a “window function” that decreases sharply at high l, so to deconvolve the spectrum one essentially has to divide by this window function to reinstate the power removed at high harmonics.
This is where it all gets very tricky. The smoothing applied is very close to the scale of the acoustic peaks so you have to do it very carefully to avoid introducing artificial structure in Cl or obliterating structure that you want to see. Moreover, a small error in the beam gets blown up in the deconvolution so one can go badly wrong in recovering the final spectrum. In other words, you need to know the beam very well to have any chance of getting close to the right answer!
The next picture gives a rough model for how much the “recovered” spectrum depends on the error produced by making even a small error in the beam profile which, for illustration only, is assumed to be Gaussian. It also shows how sensitive the shape of the deconvolved spectrum is to small errors in the beam.

Incidentally, the ratty blue line shows the spectrum obtained from a small patch of the sky rather than the whole sky. We were interested to see how much the spectrum varied across the sky so broke it up into square patches about the same size as those analysed by the Boomerang experiment. This turns out to be a pretty good way of getting the acoustic peak position but, as you can see, you lose information at low l (i.e. on scales larger than the patch).
The WMAP beam isn’t actually Gaussian – it differs quite markedly in its tails, which means that there’s even more cross-talk between different harmonic modes than in this example – but I hope you get the basic point. As Sawangwit & Shanks say, you need to know the beam very well to get the right fluctuation spectrum out. Move the acoustic peak around only slightly and all bets are off about the cosmological parameters and, perhaps, the evidence for dark energy and dark matter. Lung-Yih looked at the way the WMAP had done it and concluded that if their published beam shape was right then they had done a good job and there’s nothing substantially wrong with the results shown in the first graph.
Sawangwit & Shanks suggest the beam isn’t right so the recovered angular spectrum is suspect. I’ll need to look a bit more at the evidence they consider before commenting on that, although if anyone else has worked through it I’d be happy to hear from them through the comments box!