In 1905 Albert Einstein had his “year of miracles” in which he published three papers that changed the course of physics. One of these is extremely famous: the paper that presented the special theory of relativity. The second was a paper on the photoelectric effect that led to the development of quantum theory. The third paper is not at all so well known. It was about the theory of Brownian motion. In fact, Einstein spent an enormous amount of time and energy working on problems in statistical physics, something that isn’t so well appreciated these days as his work on the more glamorous topics of relativity and quantum theory.
Brownian motion, named after the botanist Robert Brown, is the perpetual jittering observed when small particles such as pollen grains are immersed in a fluid. It is now well known that these motions are caused by the constant bombardment of the grain by the fluid molecules. The molecules are too small to be seen directly, but their presence can be inferred from the visible effect on the much larger grain.
Brownian motion can be observed whenever any relatively massive particles (perhaps large molecules) are immersed in a fluid comprising lighter particles. Here is a little video showing the Brownian motion observed by viewing smoke under a microscope. There is a small coherent “drift” motion in this example but superimposed on that you can clearly see the effect of gas atoms bombarding the (reddish) smoke particles:
The mathematical modelling of this process was pioneered by Einstein (and also Smoluchowski), but has now become a very sophisticated field of mathematics in its own right. I don’t want to go into too much detail about the modern approach for fear of getting far too technical, so I will concentrate on the original idea.
Einstein took the view that Brownian motion could be explained in terms of a type of stochastic process called a “random walk” (or sometimes “random flight”). I think the first person to construct a mathematical model to describethis type of phenomenon was the statistician Karl Pearson. The problem he posed concerned the famous drunkard’s walk. A man starts from the origin and takes a step of length L in a random direction. After this step he turns through a random angle and takes another step of length L. He repeats this process n times. What is the probability distribution for R, his total distance from the origin after these n steps? Pearson didn’t actually solve this problem, but posed it in a letter to Nature in 1905. Only a week later, a reply from Lord Rayleigh was published in the same journal. He hadn’t worked it all out, written it up and sent it within a week though. It turns out that Rayleigh had solved essentially the same problem in a different context way back in 1880 so he had the answer readily available when he saw Pearson’s letter.
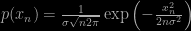
Pearson’s problem is a restricted case of a random walk, with each step having the same length. The more general case allows for a distribution of step lengths as well as random directions. To give a nice example for which virtually everything is known in a statistical sense, consider the case where each component of the step, i.e. x and y, are independent Gaussian variables, which have zero mean so that there is no preferred direction:

A similar expression holds for p(y). Now we can think of the entire random walk as being two independent walks in x and y. After n steps the total displacement in x, say, xn is given by
and again there is a similar expression for the distribution of yn . Notice that each of these distribution has a mean value of zero. On average, meaning on average over the entire probability distribution of realizations of the walk, the drunkard doesn’t go anywhere. In each individual walk he certainly does go somewhere, of course, but he is equally likely to move in any direction the probabilistic mean has to be zero. The total net displacement from the origin, rn , is just given by Pythagoras’ theorem:

from which it is quite easy to establish that the probability distribution has to be

This is called the Rayleigh distribution, and this kind of process is called a Rayleigh “flight”. The mean value of the displacement is just σ√n. By virtue of the ubiquitous central limit theorem, this result also holds in the original case discussed by Pearson in the limit of very large n. So this gives another example of the useful rule-of-thumb that quantities arising from fluctuations among n entities generally give a result that depends on the square root of n.
The figure below shows a simulation of a Rayleigh random walk. It is quite a good model for the jiggling motion executed by a Brownian particle.

The step size resulting from a collision of a Brownian particle with a molecule depends on the mass of the molecule and of the particle itself. A heavier particle will be relatively unaffected by each bash and thus take longer to diffuse than a lighter particle. Here is a nice video showing three-dimensional simulations of the diffusion of sugar molecules (left) and proteins (right) that demonstrates this effect.
Of course not even the most inebriated boozer will execute a truly random walk. One would expect each step direction to have at least some memory of the previous one. This gives rise to the idea of a correlated random walk. Such objects can be used to mimic the behaviour of geometric objects that possess some stiffness in their joints, such as proteins or other long molecules. Nowadays theory of Brownian motion and related stochastic phenomena is now considerably more sophisticated than the simply random flight models I have discussed here. The more general formalism can be used to understand many situations involving phenomena such as diffusion and percolation, not to mention gambling games and the stock market. The ability of these intrinsically “random” processes to yield surprisingly rich patterns is, to me, one of their most fascinating aspects. It takes only a little tweak to create order from chaos.

