Archive for statistics

Advanced Level Mathematics Examination, Vintage 1981

Posted in Education with tags , , , , , , on September 26, 2011 by telescoper

It’s been a while since I posted any of my old examination papers, but I wanted to put this one up before term starts in earnest. In the following you can find both papers (Paper I and Paper 2) of the Advanced Level Mathematics Examination that I sat in 1981.

Each paper is divided into two Sections: A covers pure mathematics while B encompasses applied mathematics (i.e. mechanics) and statistics. Students were generally taught only one of the two parts of Section B and in my case it was the mechanics bit that I answered in the examination. Paper I contains slightly shorter questions than Paper 2 and more of them..

Note that slide rules were allowed, but calculators had crept in by then. In fact I used my wonderful HP32-E, complete with Reverse Polish Notation. I loved it, not least because nobody ever asked to borrow it as they didn’t understand how it worked…

I also did Further Mathematics, and will post those papers in due course, but in the meantime I stress that this is just plain Mathematics.

If it looks a bit small you can use the viewer to zoom in.

I’ll be interested in comments from anyone who sat A-Level Mathematics more recently than 1981. Do you think these papers are harder than the ones you took? Is the subject matter significantly different?

Bayes and his Theorem

Posted in Bad Statistics with tags , , , , , , on November 23, 2010 by telescoper

My earlier post on Bayesian probability seems to have generated quite a lot of readers, so this lunchtime I thought I’d add a little bit of background. The previous discussion started from the result

P(B|AC) = K^{-1}P(B|C)P(A|BC) = K^{-1} P(AB|C)

where

K=P(A|C).

Although this is called Bayes’ theorem, the general form of it as stated here was actually first written down, not by Bayes but by Laplace. What Bayes’ did was derive the special case of this formula for “inverting” the binomial distribution. This distribution gives the probability of x successes in n independent “trials” each having the same probability of success, p; each “trial” has only two possible outcomes (“success” or “failure”). Trials like this are usually called Bernoulli trials, after Daniel Bernoulli. If we ask the question “what is the probability of exactly x successes from the possible n?”, the answer is given by the binomial distribution:

P_n(x|n,p)= C(n,x) p^x (1-p)^{n-x}

where

C(n,x)= n!/x!(n-x)!

is the number of distinct combinations of x objects that can be drawn from a pool of n.

You can probably see immediately how this arises. The probability of x consecutive successes is p multiplied by itself x times, or px. The probability of (n-x) successive failures is similarly (1-p)n-x. The last two terms basically therefore tell us the probability that we have exactly x successes (since there must be n-x failures). The combinatorial factor in front takes account of the fact that the ordering of successes and failures doesn’t matter.

The binomial distribution applies, for example, to repeated tosses of a coin, in which case p is taken to be 0.5 for a fair coin. A biased coin might have a different value of p, but as long as the tosses are independent the formula still applies. The binomial distribution also applies to problems involving drawing balls from urns: it works exactly if the balls are replaced in the urn after each draw, but it also applies approximately without replacement, as long as the number of draws is much smaller than the number of balls in the urn. I leave it as an exercise to calculate the expectation value of the binomial distribution, but the result is not surprising: E(X)=np. If you toss a fair coin ten times the expectation value for the number of heads is 10 times 0.5, which is five. No surprise there. After another bit of maths, the variance of the distribution can also be found. It is np(1-p).

So this gives us the probability of x given a fixed value of p. Bayes was interested in the inverse of this result, the probability of p given x. In other words, Bayes was interested in the answer to the question “If I perform n independent trials and get x successes, what is the probability distribution of p?”. This is a classic example of inverse reasoning. He got the correct answer, eventually, but by very convoluted reasoning. In my opinion it is quite difficult to justify the name Bayes’ theorem based on what he actually did, although Laplace did specifically acknowledge this contribution when he derived the general result later, which is no doubt why the theorem is always named in Bayes’ honour.

This is not the only example in science where the wrong person’s name is attached to a result or discovery. In fact, it is almost a law of Nature that any theorem that has a name has the wrong name. I propose that this observation should henceforth be known as Coles’ Law.

So who was the mysterious mathematician behind this result? Thomas Bayes was born in 1702, son of Joshua Bayes, who was a Fellow of the Royal Society (FRS) and one of the very first nonconformist ministers to be ordained in England. Thomas was himself ordained and for a while worked with his father in the Presbyterian Meeting House in Leather Lane, near Holborn in London. In 1720 he was a minister in Tunbridge Wells, in Kent. He retired from the church in 1752 and died in 1761. Thomas Bayes didn’t publish a single paper on mathematics in his own name during his lifetime but despite this was elected a Fellow of the Royal Society (FRS) in 1742. Presumably he had Friends of the Right Sort. He did however write a paper on fluxions in 1736, which was published anonymously. This was probably the grounds on which he was elected an FRS.

The paper containing the theorem that now bears his name was published posthumously in the Philosophical Transactions of the Royal Society of London in 1764.

P.S. I understand that the authenticity of the picture is open to question. Whoever it actually is, he looks  to me a bit like Laurence Olivier…


Share/Bookmark

DNA Profiling and the Prosecutor’s Fallacy

Posted in Bad Statistics with tags , , , , , , on October 23, 2010 by telescoper

It’s been a while since I posed anything in the Bad Statistics file so I thought I’d return to the subject of one of my very first blog posts, although I’ll take a different tack this time and introduce it with different, though related, example.

The topic is forensic statistics, which has been involved in some high-profile cases and which demonstrates how careful probabilistic reasoning is needed to understand scientific evidence. A good example is the use of DNA profiling evidence. Typically, this involves the comparison of two samples: one from an unknown source (evidence, such as blood or semen, collected at the scene of a crime) and a known or reference sample, such as a blood or saliva sample from a suspect. If the DNA profiles obtained from the two samples are indistinguishable then they are said to “match” and this evidence can be used in court as indicating that the suspect was in fact the origin of the sample.

In courtroom dramas, DNA matches are usually presented as being very definitive. In fact, the strength of the evidence varies very widely depending on the circumstances. If the DNA profile of the suspect or evidence consists of a combination of traits that is very rare in the population at large then the evidence can be very strong that the suspect was the contributor. If the DNA profile is not so rare then it becomes more likely that both samples match simply by chance. This probabilistic aspect makes it very important to understand the logic of the argument very carefully.

So how does it all work? A DNA profile is not a complete map of the entire genetic code contained within the cells of an individual, which would be such an enormous amount of information that it would be impractical to use it in court. Instead, a profile consists of a few (perhaps half-a-dozen) pieces of this information called alleles. An allele is one of the possible codings of DNA of the same gene at a given position (or locus) on one of the chromosomes in a cell. A single gene may, for example, determine the colour of the blossom produced by a flower; more often genes act in concert with other genes to determine the physical properties of an organism. The overall physical appearance of an individual organism, i.e. any of its particular traits, is called the phenotype and it is controlled, at least to some extent, by the set of alleles that the individual possesses. In the simplest cases, however, a single gene controls a given attribute. The gene that controls the colour of a flower will have different versions: one might produce blue flowers, another red, and so on. These different versions of a given gene are called alleles.

Some organisms contain two copies of each gene; these are said to be diploid. These copies can either be both the same, in which case the organism is homozygous, or different in which case it is heterozygous; in the latter case it possesses two different alleles for the same gene. Phenotypes for a given allele may be either dominant or recessive (although not all are characterized in this way). For example, suppose the dominated and recessive alleles are called A and a, respectively. If a phenotype is dominant then the presence of one associated allele in the pair is sufficient for the associated trait to be displayed, i.e. AA, aA and Aa will both show the same phenotype. If it is recessive, both alleles must be of the type associated with that phenotype so only aa will lead to the corresponding traits being visible.

Now we get to the probabilistic aspect of this. Suppose we want to know what the frequency of an allele is in the population, which translates into the probability that it is selected when a random individual is extracted. The argument that is needed is essentially statistical. During reproduction, the offspring assemble their alleles from those of their parents. Suppose that the alleles for any given individual are chosen independently. If p is the frequency of the dominant gene and q is the frequency of the recessive one, then we can immediately write:

p+q =1

Using the product law for probabilities, and assuming independence, the probability of homozygous dominant pairing (i.e. AA) is p2, while that of the pairing aa is q2. The probability of the heterozygotic outcome is 2pq (the two possibilities, each of probability pq are Aa and aA). This leads to the result that

p^2 +2pq +q^2 =1

This called the Hardy-Weinberg law. It can easily be extended to cases where there are two or more alleles, but I won’t go through the details here.

Now what we have to do is examine the DNA of a particular individual and see how it compares with what is known about the population. Suppose we take one locus to start with, and the individual turns out to be homozygotic: the two alleles at that locus are the same. In the population at large the frequency of that allele might be, say, 0.6. The probability that this combination arises “by chance” is therefore 0.6 times 0.6, or 0.36. Now move to the next locus, where the individual profile has two different alleles. The frequency of one is 0.25 and that of the other is 0.75. so the probability of the combination is “2pq”, which is 0.375. The probability of a match at both these loci is therefore 0.36 times 0.375, or 13.5%. The addition of further loci gradually refines the profile, so the corresponding probability reduces.

This is a perfectly bona fide statistical argument, provided the assumptions made about population genetic are correct. Let us suppose that a profile of 7 loci – a typical number for the kind of profiling used in the courts – leads to a probability of one in ten thousand of a match for a “randomly selected” individual. Now suppose the profile of our suspect matches that of the sample left at the crime scene. This means that, either the suspect left the trace there, or an unlikely coincidence happened: that, by a 1:10,000 chance, our suspect just happened to match the evidence.

This kind of result is often quoted in the newspapers as meaning that there is only a 1 in 10,000 chance that someone other than the suspect contributed the sample or, in other words, that the odds against the suspect being innocent are ten thousand to one against. Such statements are gross misrepresentations of the logic, but they have become so commonplace that they have acquired their own name: the Prosecutor’s Fallacy.

To see why this is a fallacy, i.e. why it is wrong, imagine that whatever crime we are talking about took place in a big city with 1,000,000 inhabitants. How many people in this city would have DNA that matches the profile? Answer: about 1 in 10,000 of them ,which comes to 100. Our suspect is one. In the absence of any other information, the odds are therefore roughly 100:1 against him being guilty rather than 10,000:1 in favour. In realistic cases there will of course be additional evidence that excludes the other 99 potential suspects, so it is incorrect to claim that a DNA match actually provides evidence of innocence. This converse argument has been dubbed the Defence Fallacy, but nevertheless it shows that statements about probability need to be phrased very carefully if they are to be understood properly.

All this brings me to the tragedy that I blogged about in 2008. In 1999, Mrs Sally Clark was tried and convicted for the murder of her two sons Christopher, who died aged 10 weeks in 1996, and Harry who was only eight weeks old when he died in 1998. Sudden infant deaths are sadly not as uncommon as one might have hoped: about one in eight thousand families experience such a nightmare. But what was unusual in this case was that after the second death in Mrs Clark’s family, the distinguished paediatrician Sir Roy Meadows was asked by the police to investigate the circumstances surrounding both her losses. Based on his report, Sally Clark was put on trial for murder. Sir Roy was called as an expert witness. Largely because of his testimony, Mrs Clark was convicted and sentenced to prison.

After much campaigning, she was released by the Court of Appeal in 2003. She was innocent all along. On top of the loss of her sons, the courts had deprived her of her liberty for four years. Sally Clark died in 2007 from alcohol poisoning, after having apparently taken to the bottle after three years of wrongful imprisonment.The whole episode was a tragedy and a disgrace to the legal profession.

I am not going to imply that Sir Roy Meadows bears sole responsibility for this fiasco, because there were many difficulties in Mrs Clark’s trial. One of the main issues raised on Appeal was that the pathologist working with the prosecution had failed to disclose evidence that Harry was suffering from an infection at the time he died. Nevertheless, what Professor Meadows said on oath was so shockingly stupid that he fully deserves the vilification with which he was greeted after the trial. Two other women had also been imprisoned in similar circumstances, as a result of his intervention.

At the core of the prosecution’s case was a probabilistic argument that would have been torn to shreds had any competent statistician been called to the witness box. Sadly, the defence counsel seemed to believe it as much as the jury did, and it was never rebutted. Sir Roy stated, correctly, that the odds of a baby dying of sudden infant death syndrome (or “cot death”) in an affluent, non-smoking family like Sally Clarks, were about 8,543 to one against. He then presented the probability of this happening twice in a family as being this number squared, or 73 million to one against. In the minds of the jury this became the odds against Mrs Clark being innocent of a crime.

That this argument was not effectively challenged at the trial is truly staggering.

Remember that the product rule for combining probabilities
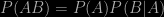
P(AB)=P(A)P(B|A)

only reduces to

P(AB)=P(A)P(B)

if the two events A and B are independent, i.e. that the occurrence of one event has no effect on the probability of the other. Nobody knows for sure what causes cot deaths, but there is every reason to believe that there might be inherited or environmental factors that might cause such deaths to be more frequent in some families than in others. In other words, sudden infant deaths might be correlated rather than independent. Furthermore, there is data about the frequency of multiple infant deaths in families. The conditional frequency of a second such event following an earlier one is not one in eight thousand or so, it’s just one in 77. This is hard evidence that should have been presented to the jury. It wasn’t.

Note that this testimony counts as doubly-bad statistics. It not only deploys the Prosecutor’s Fallacy, but applies it to what was an incorrect calculation in the first place!

Defending himself, Professor Meadows tried to explain that he hadn’t really understood the statistical argument he was presenting, but was merely repeating for the benefit of the court something he had read, which turned out to have been in a report that had not been even published at the time of the trial. He said

To me it was like I was quoting from a radiologist’s report or a piece of pathology. I was quoting the statistics, I wasn’t pretending to be a statistician.

I always thought that expert witnesses were suppose to testify about those things that they were experts about, rather than subjecting the jury second-hand flummery. Perhaps expert witnesses enjoy their status so much that they feel they can’t make mistakes about anything.

Subsequent to Mrs Clark’s release, Sir Roy Meadows was summoned to appear in front of a disciplinary tribunal at the General Medical Council. At the end of the hearing he was found guilty of serious professional misconduct, and struck off the medical register. Since he is retired anyway, this seems to me to be scant punishment. The judges and barristers who should have been alert to this miscarriage of justice have escaped censure altogether.

Although I am pleased that Professor Meadows has been disciplined in this fashion, I also hope that the General Medical Council does not think that hanging one individual out to dry will solve this problem. I addition, I think the politicians and legal system should look very hard at what went wrong in this case (and others of its type) to see how the probabilistic arguments that are essential in the days of forensic science can be properly incorporated in a rational system of justice. At the moment there is no agreed protocol for evaluating scientific evidence before it is presented to court. It is likely that such a body might have prevented the case of Mrs Clark from ever coming to trial. Scientists frequently seek the opinions of lawyers when they need to, but lawyers seem happy to handle scientific arguments themselves even when they don’t understand them at all.

I end with a quote from a press release produced by the Royal Statistical Society in the aftermath of this case:

Although many scientists have some familiarity with statistical methods, statistics remains a specialised area. The Society urges the Courts to ensure that statistical evidence is presented only by appropriately qualified statistical experts, as would be the case for any other form of expert evidence.

As far as I know, the criminal justice system has yet to implement such safeguards.


Share/Bookmark

Political Correlation

Posted in Bad Statistics, Politics with tags , , , , on August 28, 2010 by telescoper

I was just thinking that it’s been a while since I posted anything in my bad statistics category when a particularly egregious example jumped up out of this week’s Times Higher and slapped me in the face. This one goes wrong before it even gets to the statistical analysis, so I’ll only give it short shrift here, but it serves to remind us all how feeble is many academic’s grasp of the scientific method, and particularly the role of statistics within it. The perpetrator in this case is Paul Whiteley, who is Professor of Politics at the University of Essex. I’m tempted to suggest he should go and stand in the corner wearing a dunce’s cap.

Professor Whiteley argues that he has found evidence that refutes the case that increased provision of science, technology, engineering and maths (STEM) graduates are -in the words of Lord Mandelson – “crucial to in securing future prosperity”. His evidence is based on data relating to 30 OECD countries: on the one hand, their average economic growth for the period 2000-8 and, on the other, the percentage of graduates in STEM subjects for each country over the same period. He finds no statistically significant correlation between these variates. The data are plotted here:

This lack of correlation is asserted to be evidence that STEM graduates are not necessary for economic growth, but in an additional comment (for which no supporting numbers are given), it is stated that growth correlates with the total number of graduates in all subjects in each country. Hence the conclusion that higher education is good, whether or not it’s in STEM areas.

So what’s wrong with this analysis? A number of things, in fact, but I’ll start with what seems to me the most important conceptual one. In order to test a hypothesis, you have to look for a measurable effect that would be expected if the hypothesis were true, measure the effect, and then decide whether the effect is there or not. If it isn’t, you have falsified the hypothesis.

Now, would anyone really expect the % of students graduating in STEM subjects  to correlate with the growth rate in the economy over the same period? Does anyone really think that newly qualified STEM graduates have an immediate impact on economic growth? I’m sure even the most dedicated pro-science lobbyist would answer “no” to that question. Even the quote from Lord Mandelson included the crucial word “future”! Investment in these areas is expected to have a long-term benefit that would probably only show after many years. I would have been amazed had there been a correlation between measures relating to such a short period, so  absence of one says nothing whatsoever about the economic benefits of education in STEM areas.

And another thing. Why is the “percentage of graduates” chosen as a variate for this study? Surely a large % of STEM graduates is irrelevant if the total number is very small? I would have thought the fraction of the population with a STEM degree might be a better choice. Better still, since it is claimed that the overall number of graduates correlates with economic growth, why not show how this correlation with the total number of graduates breaks down by subject area?

I’m a bit suspicious about the reliability of the data too. Which country is it that produces less than 3% of its graduates in science subjects (the point at the bottom left of the plot). Surely different countries also have different types of economy wherein the role of science and technology varies considerably. It’s tempting, in fact, to see two parallel lines in the above graph – I’m not the only one to have noticed this – which may either be an artefact of small numbers chosen or might indicate that some other parameter is playing a role.

This poorly framed hypothesis test, dubious choice of variables, and highly questionable conclusions strongly suggest that Professor Whiteley had made his mind up what result he wanted and simply dressed it up in a bit of flimsy statistics. Unfortunately, such pseudoscientific flummery is all that’s needed to convince a great many out there in the big wide world, especially journalists. It’s a pity that this shoddy piece of statistical gibberish was given such prominence in the Times Higher, supported by a predictably vacuous editorial, especially when the same issue features an article about the declining standards of science journalism. Perhaps we need more STEM graduates to teach the others how to do statistical tests properly.

However, before everyone accuses me of being blind to the benefits of anything other than STEM subjects, I’ll just make it clear that, while I do think that science is very important for a large number of reasons, I do accept that higher education generally is a good thing in itself , regardless of whether it’s in physics or mediaeval latin, though I’m not sure about certain other subjects.  Universities should not be judged solely by the effect they may or may not have on short-term economic growth.

Which brings me to a final point about the difference between correlation and causation. People with more disposal income probably spend more money on, e.g., books than people with less money. Buying books doesn’t make you rich, at least not in the short-term, but it’s a good thing to do for its own sake. We shouldn’t think of higher education exclusively on the cost side of the economic equation, as politicians and bureaucrats seem increasingly to be doing,  it’s also one of the benefits.


Share/Bookmark

Science’s Dirtiest Secret?

Posted in Bad Statistics, The Universe and Stuff with tags , , , on March 19, 2010 by telescoper

My attention was drawn yesterday to an article, in a journal I never read called American Scientist, about the role of statistics in science. Since this is a theme I’ve blogged about before I had a quick look at the piece and quickly came to the conclusion that the article was excruciating drivel. However, looking at it again today, my opinion of it has changed. I still don’t think it’s very good, but it didn’t make me as cross second time around. I don’t know whether this is because I was in a particularly bad mood yesterday, or whether the piece has been edited. But although it didn’t make me want to scream, I still think it’s a poor article.

Let me start with the opening couple of paragraphs

For better or for worse, science has long been married to mathematics. Generally it has been for the better. Especially since the days of Galileo and Newton, math has nurtured science. Rigorous mathematical methods have secured science’s fidelity to fact and conferred a timeless reliability to its findings.

During the past century, though, a mutant form of math has deflected science’s heart from the modes of calculation that had long served so faithfully. Science was seduced by statistics, the math rooted in the same principles that guarantee profits for Las Vegas casinos. Supposedly, the proper use of statistics makes relying on scientific results a safe bet. But in practice, widespread misuse of statistical methods makes science more like a crapshoot.

In terms of historical accuracy, the author, Tom Siegfried, gets off to a very bad start. Science didn’t get “seduced” by statistics.  As I’ve already blogged about, scientists of the calibre of Gauss and Laplace – and even Galileo – were instrumental in inventing statistics.

And what were the “modes of calculation that had served it so faithfully” anyway? Scientists have long  recognized the need to understand the behaviour of experimental errors, and to incorporate the corresponding uncertainty in their analysis. Statistics isn’t a “mutant form of math”, it’s an integral part of the scientific method. It’s a perfectly sound discipline, provided you know what you’re doing…

And that’s where, despite the sloppiness of his argument,  I do have some sympathy with some of what  Siegfried says. What has happened, in my view, is that too many people use statistical methods “off the shelf” without thinking about what they’re doing. The result is that the bad use of statistics is widespread. This is particularly true in disciplines that don’t have a well developed mathematical culture, such as some elements of biosciences and medicine, although the physical sciences have their own share of horrors too.

I’ve had a run-in myself with the authors of a paper in neurobiology who based extravagant claims on an inappropriate statistical analysis.

What is wrong is therefore not the use of statistics per se, but the fact that too few people understand – or probably even think about – what they’re trying to do (other than publish papers).

It’s science’s dirtiest secret: The “scientific method” of testing hypotheses by statistical analysis stands on a flimsy foundation. Statistical tests are supposed to guide scientists in judging whether an experimental result reflects some real effect or is merely a random fluke, but the standard methods mix mutually inconsistent philosophies and offer no meaningful basis for making such decisions. Even when performed correctly, statistical tests are widely misunderstood and frequently misinterpreted. As a result, countless conclusions in the scientific literature are erroneous, and tests of medical dangers or treatments are often contradictory and confusing.

Quite, but what does this mean for “science’s dirtiest secret”? Not that it involves statistical reasoning, but that large numbers of scientists haven’t a clue what they’re doing when they do a statistical test. And if this is the case with practising scientists, how can we possibly expect the general public to make sense of what is being said by the experts? No wonder people distrust scientists when so many results confidently announced on the basis of totally spurious arguments, turn out to be be wrong.

The problem is that the “standard” statistical methods shouldn’t be “standard”. It’s true that there are many methods that work in a wide range of situations, but simply assuming they will work in any particular one without thinking about it very carefully is a very dangerous strategy. Siegfried discusses examples where the use of “p-values” leads to incorrect results. It doesn’t surprise me that such examples can be found, as the misinterpretation of p-values is rife even in numerate disciplines, and matters get worse for those practitioners who combine p-values from different studies using meta-analysis, a method which has no mathematical motivation whatsoever and which should be banned. So indeed should a whole host of other frequentist methods which offer limitless opportunities for to make a complete botch of the data arising from a research project.

Siegfried goes on

Nobody contends that all of science is wrong, or that it hasn’t compiled an impressive array of truths about the natural world. Still, any single scientific study alone is quite likely to be incorrect, thanks largely to the fact that the standard statistical system for drawing conclusions is, in essence, illogical.

Any single scientific study done along is quite likely to be incorrect. Really? Well, yes, if it is done incorrectly. But the point is not that they are incorrect because they use statistics, but that they are incorrect because they are done incorrectly. Many scientists don’t even understand the statistics well enough to realise that what they’re doing is wrong.

If I had my way, scientific publications – especially in disciplines that impact directly on everyday life, such as medicine – should adopt a much more rigorous policy on statistical analysis and on the way statistical significance is reported. I favour the setting up of independent panels whose responsibility is to do the statistical data analysis on behalf of those scientists who can’t be trusted to do it correctly themselves.

Having started badly, and lost its way in the middle, the article ends disappointingly too. Having led us through a wilderness of failed frequentists analyses, he finally arrives at a discussion of the superior Bayesian methodology, in irritatingly half-hearted fashion.

But Bayesian methods introduce a confusion into the actual meaning of the mathematical concept of “probability” in the real world. Standard or “frequentist” statistics treat probabilities as objective realities; Bayesians treat probabilities as “degrees of belief” based in part on a personal assessment or subjective decision about what to include in the calculation. That’s a tough placebo to swallow for scientists wedded to the “objective” ideal of standard statistics….

Conflict between frequentists and Bayesians has been ongoing for two centuries. So science’s marriage to mathematics seems to entail some irreconcilable differences. Whether the future holds a fruitful reconciliation or an ugly separation may depend on forging a shared understanding of probability.

The difficulty with this piece as a whole is that it reads as an anti-science polemic: “Some science results are based on bad statistics, therefore statistics is bad and science that uses statistics is bogus.” I don’t know whether that’s what the author intended, or whether it was just badly written.

I’d say the true state of affairs is different. A lot of bad science is published, and a lot of that science is bad because it uses statistical reasoning badly. You wouldn’t however argue that a screwdriver is no use because some idiot tries to hammer a nail in with one.

Only a bad craftsman blames his tools.

The League of Small Samples

Posted in Bad Statistics with tags , , , on January 14, 2010 by telescoper

This morning I was just thinking that it’s been a while since I’ve filed anything in the category marked bad statistics when I glanced at today’s copy of the Times Higher and found something that’s given me an excuse to rectify my lapse. Today saw the publication of said organ’s new Student Experience Survey which ranks  British Universities in order of the responses given by students to questions about various aspects of the teaching, social life and so  on. Here are the main results, sorted in decreasing order:

1 Loughborough University 84.9 128
2 University of Cambridge, The 82.6 259
3 University of Oxford, The 82.6 197
4 University of Sheffield, The 82.3 196
5 University of East Anglia, The 82.1 122
6 University of Wales, Aberystwyth 82.1 97
7 University of Leeds, The 81.9 185
8 University of Dundee, The 80.8 75
9 University of Southampton, The 80.6 164
10 University of Glasgow, The 80.6 136
11 University of Exeter, The 80.3 160
12 University of Durham 80.3 189
13 University of Leicester, The 79.9 151
14 University of St Andrews, The 79.9 104
15 University of Essex, The 79.5 65
16 University of Warwick, The 79.5 190
17 Cardiff University 79.4 180
18 University of Central Lancashire, The 79.3 88
19 University of Nottingham, The 79.2 233
20 University of Newcastle-upon-Tyne, The 78.9 145
21 University of Bath, The 78.7 142
22 University of Wales, Bangor 78.7 43
23 University of Edinburgh, The 78.1 190
24 University of Birmingham, The 78.0 179
25 University of Surrey, The 77.8 100
26 University of Sussex, The 77.6 49
27 University of Lancaster, The 77.6 123
28 University of Stirling, The 77.6 44
29 University of Wales, Swansea 77.5 61
30 University of Kent at Canterbury, The 77.3 116
30 University of Teesside, The 77.3 127
32 University of Hull, The 77.2 87
33 Robert Gordon University, The 77.2 57
34 University of Lincoln, The 77.0 121
35 Nottingham Trent University, The 76.9 192
36 University College Falmouth 76.8 40
37 University of Gloucestershire 76.8 74
38 University of Liverpool, The 76.7 89
39 University of Keele, The 76.5 57
40 University of Northumbria at Newcastle, The 76.4 149
41 University of Plymouth, The 76.3 190
41 University of Reading, The 76.3 117
43 Queen’s University of Belfast, The 76.0 149
44 University of Aberdeen, The 75.9 84
45 University of Strathclyde, The 75.7 72
46 Staffordshire University 75.6 85
47 University of York, The 75.6 121
48 St George’s Medical School 75.4 33
49 Southampton Solent University 75.2 34
50 University of Portsmouth, The 75.2 141
51 Queen Mary, University of London 75.2 104
52 University of Manchester 75.1 221
53 Aston University 75.0 66
54 University of Derby 75.0 33
55 University College London 74.8 114
56 Sheffield Hallam University 74.8 159
57 Glasgow Caledonian University 74.6 72
58 King’s College London 74.6 101
59 Brunel University 74.4 64
60 Heriot-Watt University 74.1 35
61 Imperial College of Science, Technology & Medicine 73.9 111
62 De Montfort University 73.6 83
63 Bath Spa University 73.4 64
64 Bournemouth University 73.3 128
65 University of the West of England, Bristol 73.3 207
66 Leeds Metropolitan University 73.1 143
67 University of Chester 72.5 61
68 University of Bristol, The 72.3 145
69 Royal Holloway, University of London 72.1 59
70 Canterbury Christ Church University 71.8 78
71 University of Huddersfield, The 71.8 97
72 York St John University College 71.8 31
72 University of Wales Institute, Cardiff 71.8 41
74 University of Glamorgan 71.6 84
75 University of Salford, The 71.2 58
76 Roehampton University 71.1 47
77 Manchester Metropolitan University, The 71.1 131
78 University of Northampton 70.8 42
79 University of Sunderland, The 70.8 61
80 Kingston University 70.7 121
81 University of Bradford, The 70.6 33
82 Oxford Brookes University 70.5 99
83 University of Ulster 70.3 61
84 Coventry University 69.9 82
85 University of Brighton, The 69.4 106
86 University of Hertfordshire 68.9 138
87 University of Bedfordshire 68.6 44
88 Queen Margaret University, Edinburgh 68.5 35
89 London School of Economics and Political Science 68.4 73
90 Royal Veterinary College, The 68.2 43
91 Anglia Ruskin University 68.1 71
92 Birmingham City University 67.7 109
93 University of Wolverhampton, The 67.5 72
94 Liverpool John Moores University 67.2 103
95 Goldsmiths College 66.9 42
96 Napier University 65.5 63
97 London South Bank University 64.9 44
98 City University 64.6 44
99 University of Greenwich, The 63.9 67
100 University of the Arts London 62.8 40
101 Middlesex University 61.4 51
102 University of Westminster, The 60.4 76
103 London Metropolitan University 55.2 37
104 University of East London, The 54.2 41
10465

The maximum overall score is 100 and the figure in the rightmost column is the number of students from that particular University that contributed to the survey. The total number of students involved is shown at the bottom, i.e. 10465.

My current employer, Cardiff University, comes out pretty well (17th) in this league table, but some do surprisingly poorly such as Imperial which is 61st. No doubt University spin doctors around the country will be working themselves into a frenzy trying how best to present their showing in the list, but before they get too carried away I want to dampen their enthusiasm.

Let’s take Cardiff as an example. The number of students whose responses produced the score of 79.4 was just 180. That’s by no means the smallest sample in the survey, either. Cardiff University has approximately 20,000 undergraduates. The score in this table is therefore obtained from less than 1% of the relevant student population. How representative can the results be, given that the sample is so incredibly small?

What is conspicuous by its absence from this table is any measure of the “margin-of-error” of the estimated score. What I mean by this is how much the sample score would change for Cardiff if a different set of 180 students were involved. Unless every Cardiff student gives Cardiff exactly 79.4 then the score will vary from sample to sample. The smaller the sample, the larger the resulting uncertainty.

Given a survey of this type it should be quite straightforward to calculate the spread of scores from student to student within a sample from a given University in terms of the standard deviation, σ, as well as the mean score. Unfortunately, this survey does not include this information. However, lets suppose for the sake of argument that the standard deviation for Cardiff is quite small, say 10% of the mean value, i.e. 7.94. I imagine that it’s much larger than that, in fact, but this is just meant to be by way of an illustration.

If you have a sample size of  N then the standard error of the mean is going to be roughly (σ⁄√N) which, for Cardiff, is about 0.6. Assuming everything has a normal distribution, this would mean that the “true” score for the full population of Cardiff students has a 95% chance of being within two standard errors of the mean, i.e. between 78.2 and 80.6. This means Cardiff could really be as high as 9th place or as low as 23rd, and that’s making very conservative assumptions about how much one student differs from another within each institution.

That example is just for illustration, and the figures may well be wrong, but my main gripe is that I don’t understand how these guys can get away with publishing results like this without listing the margin of error at all. Perhaps its because that would make it obvious how unreliable the rankings are? Whatever the reason we’d never get away with publishing results without errors in a serious scientific journal.

Still, at least there’s been one improvement since last year: the 2009 results gave every score to two decimal places! My A-level physics teacher would have torn strips off me if I’d done that!

Precision, you see, is not the same as accuracy….

Astrostats

Posted in Bad Statistics, The Universe and Stuff with tags , , , , , , , , , on September 20, 2009 by telescoper

A few weeks ago I posted an item on the theme of how gambling games were good for the development of probability theory. That piece  contained a mention of one astronomer (Christiaan Huygens), but I wanted to take the story on a little bit to make the historical connection between astronomy and statistics more explicit.

Once the basics of mathematical probability had been worked out, it became possible to think about applying probabilistic notions to problems in natural philosophy. Not surprisingly, many of these problems were of astronomical origin but, on the way, the astronomers that tackled them also derived some of the basic concepts of statistical theory and practice. Statistics wasn’t just something that astronomers took off the shelf and used; they made fundamental contributions to the development of the subject itself.

The modern subject we now know as physics really began in the 16th and 17th century, although at that time it was usually called Natural Philosophy. The greatest early work in theoretical physics was undoubtedly Newton’s great Principia, published in 1687, which presented his idea of universal gravitation which, together with his famous three laws of motion, enabled him to account for the orbits of the planets around the Sun. But majestic though Newton’s achievements undoubtedly were, I think it is fair to say that the originator of modern physics was Galileo Galilei.

Galileo wasn’t as much of a mathematical genius as Newton, but he was highly imaginative, versatile and (very much unlike Newton) had an outgoing personality. He was also an able musician, fine artist and talented writer: in other words a true Renaissance man.  His fame as a scientist largely depends on discoveries he made with the telescope. In particular, in 1610 he observed the four largest satellites of Jupiter, the phases of Venus and sunspots. He immediately leapt to the conclusion that not everything in the sky could be orbiting the Earth and openly promoted the Copernican view that the Sun was at the centre of the solar system with the planets orbiting around it. The Catholic Church was resistant to these ideas. He was hauled up in front of the Inquisition and placed under house arrest. He died in the year Newton was born (1642).

These aspects of Galileo’s life are probably familiar to most readers, but hidden away among scientific manuscripts and notebooks is an important first step towards a systematic method of statistical data analysis. Galileo performed numerous experiments, though he certainly carry out the one with which he is most commonly credited. He did establish that the speed at which bodies fall is independent of their weight, not by dropping things off the leaning tower of Pisa but by rolling balls down inclined slopes. In the course of his numerous forays into experimental physics Galileo realised that however careful he was taking measurements, the simplicity of the equipment available to him left him with quite large uncertainties in some of the results. He was able to estimate the accuracy of his measurements using repeated trials and sometimes ended up with a situation in which some measurements had larger estimated errors than others. This is a common occurrence in many kinds of experiment to this day.

Very often the problem we have in front of us is to measure two variables in an experiment, say X and Y. It doesn’t really matter what these two things are, except that X is assumed to be something one can control or measure easily and Y is whatever it is the experiment is supposed to yield information about. In order to establish whether there is a relationship between X and Y one can imagine a series of experiments where X is systematically varied and the resulting Y measured.  The pairs of (X,Y) values can then be plotted on a graph like the example shown in the Figure.

XY

In this example on it certainly looks like there is a straight line linking Y and X, but with small deviations above and below the line caused by the errors in measurement of Y. This. You could quite easily take a ruler and draw a line of “best fit” by eye through these measurements. I spent many a tedious afternoon in the physics labs doing this sort of thing when I was at school. Ideally, though, what one wants is some procedure for fitting a mathematical function to a set of data automatically, without requiring any subjective intervention or artistic skill. Galileo found a way to do this. Imagine you have a set of pairs of measurements (xi,yi) to which you would like to fit a straight line of the form y=mx+c. One way to do it is to find the line that minimizes some measure of the spread of the measured values around the theoretical line. The way Galileo did this was to work out the sum of the differences between the measured yi and the predicted values mx+c at the measured values x=xi. He used the absolute difference |yi-(mxi+c)| so that the resulting optimal line would, roughly speaking, have as many of the measured points above it as below it. This general idea is now part of the standard practice of data analysis, and as far as I am aware, Galileo was the first scientist to grapple with the problem of dealing properly with experimental error.

error

The method used by Galileo was not quite the best way to crack the puzzle, but he had it almost right. It was again an astronomer who provided the missing piece and gave us essentially the same method used by statisticians (and astronomy) today.

Karl Friedrich Gauss was undoubtedly one of the greatest mathematicians of all time, so it might be objected that he wasn’t really an astronomer. Nevertheless he was director of the Observatory at Göttingen for most of his working life and was a keen observer and experimentalist. In 1809, he developed Galileo’s ideas into the method of least-squares, which is still used today for curve fitting.

This approach involves basically the same procedure but involves minimizing the sum of [yi-(mxi+c)]2 rather than |yi-(mxi+c)|. This leads to a much more elegant mathematical treatment of the resulting deviations – the “residuals”.  Gauss also did fundamental work on the mathematical theory of errors in general. The normal distribution is often called the Gaussian curve in his honour.

After Galileo, the development of statistics as a means of data analysis in natural philosophy was dominated by astronomers. I can’t possibly go systematically through all the significant contributors, but I think it is worth devoting a paragraph or two to a few famous names.

I’ve already mentioned Jakob Bernoulli, whose famous book on probability was probably written during the 1690s. But Jakob was just one member of an extraordinary Swiss family that produced at least 11 important figures in the history of mathematics.  Among them was Daniel Bernoulli who was born in 1700.  Along with the other members of his famous family, he had interests that ranged from astronomy to zoology. He is perhaps most famous for his work on fluid flows which forms the basis of much of modern hydrodynamics, especially Bernouilli’s principle, which accounts for changes in pressure as a gas or liquid flows along a pipe of varying width.
But the elder Jakob’s work on gambling clearly also had some effect on Daniel, as in 1735 the younger Bernoulli published an exceptionally clever study involving the application of probability theory to astronomy. It had been known for centuries that the orbits of the planets are confined to the same part in the sky as seen from Earth, a narrow band called the Zodiac. This is because the Earth and the planets orbit in approximately the same plane around the Sun. The Sun’s path in the sky as the Earth revolves also follows the Zodiac. We now know that the flattened shape of the Solar System holds clues to the processes by which it formed from a rotating cloud of cosmic debris that formed a disk from which the planets eventually condensed, but this idea was not well established in the time of Daniel Bernouilli. He set himself the challenge of figuring out what the chance was that the planets were orbiting in the same plane simply by chance, rather than because some physical processes confined them to the plane of a protoplanetary disk. His conclusion? The odds against the inclinations of the planetary orbits being aligned by chance were, well, astronomical.

The next “famous” figure I want to mention is not at all as famous as he should be. John Michell was a Cambridge graduate in divinity who became a village rector near Leeds. His most important idea was the suggestion he made in 1783 that sufficiently massive stars could generate such a strong gravitational pull that light would be unable to escape from them.  These objects are now known as black holes (although the name was coined much later by John Archibald Wheeler). In the context of this story, however, he deserves recognition for his use of a statistical argument that the number of close pairs of stars seen in the sky could not arise by chance. He argued that they had to be physically associated, not fortuitous alignments. Michell is therefore credited with the discovery of double stars (or binaries), although compelling observational confirmation had to wait until William Herschel’s work of 1803.

It is impossible to overestimate the importance of the role played by Pierre Simon, Marquis de Laplace in the development of statistical theory. His book A Philosophical Essay on Probabilities, which began as an introduction to a much longer and more mathematical work, is probably the first time that a complete framework for the calculation and interpretation of probabilities ever appeared in print. First published in 1814, it is astonishingly modern in outlook.

Laplace began his scientific career as an assistant to Antoine Laurent Lavoiser, one of the founding fathers of chemistry. Laplace’s most important work was in astronomy, specifically in celestial mechanics, which involves explaining the motions of the heavenly bodies using the mathematical theory of dynamics. In 1796 he proposed the theory that the planets were formed from a rotating disk of gas and dust, which is in accord with the earlier assertion by Daniel Bernouilli that the planetary orbits could not be randomly oriented. In 1776 Laplace had also figured out a way of determining the average inclination of the planetary orbits.

A clutch of astronomers, including Laplace, also played important roles in the establishment of the Gaussian or normal distribution.  I have also mentioned Gauss’s own part in this story, but other famous astronomers played their part. The importance of the Gaussian distribution owes a great deal to a mathematical property called the Central Limit Theorem: the distribution of the sum of a large number of independent variables tends to have the Gaussian form. Laplace in 1810 proved a special case of this theorem, and Gauss himself also discussed it at length.

A general proof of the Central Limit Theorem was finally furnished in 1838 by another astronomer, Friedrich Wilhelm Bessel– best known to physicists for the functions named after him – who in the same year was also the first man to measure a star’s distance using the method of parallax. Finally, the name “normal” distribution was coined in 1850 by another astronomer, John Herschel, son of William Herschel.

I hope this gets the message across that the histories of statistics and astronomy are very much linked. Aspiring young astronomers are often dismayed when they enter research by the fact that they need to do a lot of statistical things. I’ve often complained that physics and astronomy education at universities usually includes almost nothing about statistics, because that is the one thing you can guarantee to use as a researcher in practically any branch of the subject.

Over the years, statistics has become regarded as slightly disreputable by many physicists, perhaps echoing Rutherford’s comment along the lines of “If your experiment needs statistics, you ought to have done a better experiment”. That’s a silly statement anyway because all experiments have some form of error that must be treated statistically, but it is particularly inapplicable to astronomy which is not experimental but observational. Astronomers need to do statistics, and we owe it to the memory of all the great scientists I mentioned above to do our statistics properly.

A Mountain of Truth

Posted in Bad Statistics, The Universe and Stuff with tags , , , , on August 1, 2009 by telescoper

I spent the last week at a conference in a beautiful setting amidst the hills overlooking the small town of Ascona by Lake Maggiore in the canton of Ticino, the Italian-speaking part of Switzerland. To be more precise we were located in a conference centre called the Centro Stefano Franscini on  Monte Verità. The meeting was COSMOSTATS which aimed

… to bring together world-class leading figures in cosmology and particle physics, as well as renowned statisticians, in order to exchange knowledge and experience in dealing with large and complex data sets, and to meet the challenge of upcoming large cosmological surveys.

Although I didn’t know much about the location beforehand it turns out to have an extremely interesting history, going back about a hundred years. The first people to settle there, around the end of the 19th Century,  were anarchists who had sought refuge there during times of political upheaval. The Locarno region had long been a popular place for people with “alternative” lifestyles. Monte Verità (“The Mountain of Truth”) was eventually bought by Henri Oedenkoven, the son of a rich industrialist, and he  set up a sort of commune there at  which the residents practised vegetarianism, naturism, free love  and other forms of behaviour that were intended as a reaction against the scientific and technological progress of the time.  From about 1904 onward the centre became a sanatorium where the discipline of psychoanalysis flourished and it later attracted many artists. In 1927,   Baron Eduard Von dey Heydt took the place over. He was a great connoisseur of Oriental philosophy and art collector and he established  a large collection at Monte Verità, much of which is still there because when the Baron died in 1956 he left Monte Verità to the local Canton.

Given the bizarre collection of anarchists, naturists, theosophists (and even vegetarians) that used to live in Monte Verità, it is by no means out of keeping with the tradition that it should eventually play host to a conference of cosmologists and statisticians.

The  conference itself was interesting, and I was lucky enough to get to chair a session with three particularly interesting talks in it. In general, though, these dialogues between statisticians and physicists don’t seem to be as productive as one might have hoped. I’ve been to a few now, and although there’s a lot of enjoyable polemic they don’t work too well at changing anyone’s opinion or providing new insights.

We may now have mountains of new data in cosmology in particle physics but that hasn’t always translated into a corresponding mountain of truth. Intervening between our theories and observations lies the vexed question of how best to analyse the data and what the results actually mean. As always, lurking in the background, was the long-running conflict between adherents of the Bayesian and frequentist interpretations of probability. It appears that cosmologists -at least those represented at this meeting – tend to be Bayesian while particle physicists are almost exclusively frequentist. I’ll refrain from commenting on what this might mean. However, I was perplexed by various comments made during the conference about the issue of coverage. which is discussed rather nicely in some detail here. To me the question of of whether a Bayesian method has good frequentist coverage properties  is completely irrelevant. Bayesian methods ask different questions (actually, ones to which scientists want to know the answer) so it is not surprising that they give different answers. Measuring a Bayesian method according to  a frequentist criterion is completely pointless whichever camp you belong to.

The irrelevance of coverage was one thing that the previous residents knew better than some of the conference guests:

mvtanz3

I’d like to thank  Uros Seljak, Roberto Trotta and Martin Kunz for organizing the meeting in such a  picturesque and intriguing place.

Statistics Matters, Science Matters

Posted in Science Politics with tags , , on April 7, 2009 by telescoper

I thought I’d say something about why I think statistics and statistical reasoning are so important. Of course they are important in science. In fact, I think they lie at the very core of the scientific method, although I am still surprised how few practising scientists are comfortable even with statistical language. A more important problem is the popular impression that science is about facts and absolute truths. It isn’t. It’s a process. In order to advance it has to question itself.

Statistical reasoning also applies to many facets of everyday life, including business, commerce, transport, the media, and politics. Probability even plays a role in personal relationships, though mostly at a subconscious level. It is a feature of everyday life that science and technology are deeply embedded in every aspect of what we do each day. Science has given us greater levels of comfort, better health care, and a plethora of labour-saving devices. It has also given us unprecedented ability to destroy the environment and each other, whether through accident or design.

Civilized societies face rigorous challenges in this century. We must confront the threat of climate change and forthcoming energy crises. We must find better ways of resolving conflicts peacefully lest nuclear or conventional weapons lead us to global catastrophe. We must stop large-scale pollution or systematic destruction of the biosphere that nurtures us. And we must do all of these things without abandoning the many positive things that science has brought us. Abandoning science and rationality by retreating into religious or political fundamentalism would be a catastrophe for humanity.

Unfortunately, recent decades have seen a wholesale breakdown of trust between scientists and the public at large. This is due partly to the deliberate abuse of science for immoral purposes, and partly to the sheer carelessness with which various agencies have exploited scientific discoveries without proper evaluation of the risks involved. The abuse of statistical arguments have undoubtedly contributed to the suspicion with which many individuals view science.

There is an increasing alienation between scientists and the general public. Many fewer students enrol for courses in physics and chemistry than a a few decades ago. Fewer graduates mean fewer qualified science teachers in schools. This is a vicious cycle that threatens our future. It must be broken.

The danger is that the decreasing level of understanding of science in society means that knowledge (as well as its consequent power) becomes concentrated in the minds of a few individuals. This could have dire consequences for the future of our democracy. Even as things stand now, very few Members of Parliament are scientifically literate. How can we expect to control the application of science when the necessary understanding rests with an unelected “priesthood” that is hardly understood by, or represented in, our democratic institutions?

Very few journalists or television producers know enough about science to report sensibly on the latest discoveries or controversies. As a result, important matters that the public needs to know about do not appear at all in the media, or if they do it is in such a garbled fashion that they do more harm than good.

Years ago I used to listen to radio interviews with scientists on the Today programme on BBC Radio 4. I even did such an interview once. It is a deeply frustrating experience. The scientist usually starts by explaining what the discovery is about in the way a scientist should, with careful statements of what is assumed, how the data is interpreted, and what other possible interpretations might be and the likely sources of error. The interviewer then loses patience and asks for a yes or no answer. The scientist tries to continue, but is badgered. Either the interview ends as a row, or the scientist ends up stating a grossly oversimplified version of the story.

Some scientists offer the oversimplified version at the outset, of course, and these are the ones that contribute to the image of scientists as priests. Such individuals often believe in their theories in exactly the same way that some people believe religiously. Not with the conditional and possibly temporary belief that characterizes the scientific method, but with the unquestioning fervour of an unthinking zealot. This approach may pay off for the individual in the short term, in popular esteem and media recognition – but when it goes wrong it is science as a whole that suffers. When a result that has been proclaimed certain is later shown to be false, the result is widespread disillusionment.

The worst example of this tendency that I can think of is the constant use of the phrase “Mind of God” by theoretical physicists to describe fundamental theories. This is not only meaningless but also damaging. As scientists we should know better than to use it. Our theories do not represent absolute truths: they are just the best we can do with the available data and the limited powers of the human mind. We believe in our theories, but only to the extent that we need to accept working hypotheses in order to make progress. Our approach is pragmatic rather than idealistic. We should be humble and avoid making extravagant claims that can’t be justified either theoretically or experimentally.

The more that people get used to the image of “scientist as priest” the more dissatisfied they are with real science. Most of the questions asked of scientists simply can’t be answered with “yes” or “no”. This leaves many with the impression that science is very vague and subjective. The public also tend to lose faith in science when it is unable to come up with quick answers. Science is a process, a way of looking at problems not a list of ready-made answers to impossible problems. Of course it is sometimes vague, but I think it is vague in a rational way and that’s what makes it worthwhile. It is also the reason why science has led to so many objectively measurable advances in our understanding of the World.

I don’t have any easy answers to the question of how to cure this malaise, but do have a few suggestions. It would be easy for a scientist such as myself to blame everything on the media and the education system, but in fact I think the responsibility lies mainly with ourselves. We are usually so obsessed with our own research, and the need to publish specialist papers by the lorry-load in order to advance our own careers that we usually spend very little time explaining what we do to the public or why.

I think every working scientist in the country should be required to spend at least 10% of their time working in schools or with the general media on “outreach”, including writing blogs like this. People in my field – astronomers and cosmologists – do this quite a lot, but these are areas where the public has some empathy with what we do. If only biologists, chemists, nuclear physicists and the rest were viewed in such a friendly light. Doing this sort of thing is not easy, especially when it comes to saying something on the radio that the interviewer does not want to hear. Media training for scientists has been a welcome recent innovation for some branches of science, but most of my colleagues have never had any help at all in this direction.

The second thing that must be done is to improve the dire state of science education in schools. Over the last two decades the national curriculum for British schools has been dumbed down to the point of absurdity. Pupils that leave school at 18 having taken “Advanced Level” physics do so with no useful knowledge of physics at all, even if they have obtained the highest grade. I do not at all blame the students for this; they can only do what they are asked to do. It’s all the fault of the educationalists, who have done the best they can for a long time to convince our young people that science is too hard for them. Science can be difficult, of course, and not everyone will be able to make a career out of it. But that doesn’t mean that it should not be taught properly to those that can take it in. If some students find it is not for them, then so be it. I always wanted to be a musician, but never had the talent for it.

I realise I must sound very gloomy about this, but I do think there are good prospects that the gap between science and society may gradually be healed. The fact that the public distrust scientists leads many of them to question us, which is a very good thing. They should question us and we should be prepared to answer them. If they ask us why, we should be prepared to give reasons. If enough scientists engage in this process then what will emerge is and understanding of the enduring value of science. I don’t just mean through the DVD players and computer games science has given us, but through its cultural impact. It is part of human nature to question our place in the Universe, so science is part of what we are. It gives us purpose. But it also shows us a way of living our lives. Except for a few individuals, the scientific community is tolerant, open, internationally-minded, and imbued with a philosophy of cooperation. It values reason and looks to the future rather than the past. Like anyone else, scientists will always make mistakes, but we can always learn from them. The logic of science may not be infallible, but it’s probably the best logic there is in a world so filled with uncertainty.

Social Physics and Astronomy

Posted in The Universe and Stuff with tags , , , , , on March 23, 2009 by telescoper

When I give popular talks about Cosmology,  I sometimes look for appropriate analogies or metaphors in television programmes about forensic science, such as CSI: Crime Scene Investigation which I used to watch quite regularly (to the disdain of many of my colleagues and friends). Cosmology is methodologically similar to forensic science because it is generally necessary in both these fields to proceed by observation and inference, rather than experiment and deduction: cosmologists have only one Universe;  forensic scientists have only one scene of the crime. They can collect trace evidence, look for fingerprints, establish or falsify alibis, and so on. But they can’t do what a laboratory physicist or chemist would typically try to do: perform a series of similar experimental crimes under slightly different physical conditions. What we have to do in cosmology is the same as what detectives do when pursuing an investigation: make inferences and deductions within the framework of a hypothesis that we continually subject to empirical test. This process carries on until reasonable doubt is exhausted, if that ever happens.

Of course there is much more pressure on detectives to prove guilt than there is on cosmologists to establish the truth about our Cosmos. That’s just as well, because there is still a very great deal we do not know about how the Universe works.I have a feeling that I’ve stretched this analogy to breaking point but at least it provides some kind of excuse for writing about an interesting historical connection between astronomy and forensic science by way of the social sciences.

The gentleman shown in the picture on the left is Lambert Adolphe Jacques Quételet, a Belgian astronomer who lived from 1796 to 1874. His principal research interest was in the field of celestial mechanics. He was also an expert in statistics. In Quételet’s  time it was by no means unusual for astronomers to well-versed in statistics, but he  was exceptionally distinguished in that field. Indeed, Quételet has been called “the father of modern statistics”. and, amongst other things he was responsible for organizing the first ever international conference on statistics in Paris in 1853.


His fame as a statistician owed less to its applications to astronomy, however, than the fact that in 1835 he had written a very influential book which, in English, was titled A Treatise on Man but whose somewhat more verbose original French title included the phrase physique sociale (“social physics”).

Apparently the philosopher Auguste Comte was annoyed that Quételet appropriated the phrase “social physics” because he did not approve of the quantitative statistical-based  approach that it had come to represent. For that reason Comte  ditched the term from his own work and invented the subject of  sociology…

Quételet had been struck not only by the regular motions performed by the planets across the sky, but also by the existence of strong patterns in social phenomena, such as suicides and crime. If statistics was essential for understanding the former, should it not be deployed in the study of the latter? Quételet’s first book was an attempt to apply statistical methods to the development of man’s physical and intellectual faculties. His follow-up book Anthropometry, or the Measurement of Different Faculties in Man (1871) carried these ideas further, at the expense of a much clumsier title.

This foray into “social physics” was controversial at the time, for good reason. It also made Quételet extremely famous in his lifetime and his influence became widespread. For example, Francis Galton wrote about the deep impact Quételet had on a certain British lady:

Her statistics were more than a study, they were indeed her religion. For her Quételet was the hero as scientist, and the presentation copy of his “Social Physics” is annotated on every page. Florence Nightingale believed – and in all the actions of her life acted on that belief – that the administrator could only be successful if he were guided by statistical knowledge. The legislator – to say nothing of the politician – too often failed for want of this knowledge. Nay, she went further; she held that the universe – including human communities – was evolving in accordance with a divine plan; that it was man’s business to endeavour to understand this plan and guide his actions in sympathy with it. But to understand God’s thoughts, she held we must study statistics, for these are the measure of His purpose. Thus the study of statistics was for her a religious duty.

The name of the lady in question was Florence Nightingale. Not many people know that she was an adept statistician who was an early advocate of the use of pie charts to represent data graphically; she apparently found them useful when dealing with dim-witted army officers and dimmer-witted politicians.

The type of thinking described in the quote  also spawned a number of highly unsavoury developments in pseudoscience, such as the eugenics movement (in which Galton himself was involved), and some of the vile activities related to it that were carried out in Nazi Germany. But an idea is not responsible for the people who believe in it, and Quételet’s work did lead to many good things, such as the beginnings of forensic science.

A young medical student by the name of Louis-Adolphe Bertillon was excited by the whole idea of “social physics”, to the extent that he found himself imprisoned for his dangerous ideas during the revolution of 1848, along with one of his Professors, Achile Guillard, who later invented the subject of demography, the study of racial groups and regional populations. When they were both released, Bertillon became a close confidante of Guillard and eventually married his daughter Zoé. Their second son, Adolphe Bertillon, turned out to be a prodigy.

Young Adolphe was so inspired by Quételet’s work, which had no doubt been introduced to him by his father, that he hit upon a novel way to solve crimes. He would create a database of measured physical characteristics of convicted criminals. He chose 11 basic measurements, including length and width of head, right ear, forearm, middle and ring fingers, left foot, height, length of trunk, and so on. On their own none of these individual characteristics could be probative, but it ought to be possible to use a large number of different measurements to establish identity with a very high probability. Indeed, after two years’ study, Bertillon reckoned that the chances of two individuals having all 11 measurements in common were about four million to one. He further improved the system by adding photographs, in portrait and from the side, and a note of any special marks, like scars or moles.

Bertillonage, as this system became known, was rather cumbersome but proved highly successful in a number of high-profile criminal cases in Paris. By 1892, Bertillon was exceedingly famous but nowadays the word bertillonage only appears in places like the Observer’s Azed crossword.

The main reason why Bertillon’s fame subsided and his system fell into disuse was the development of an alternative and much simpler method of criminal identification: fingerprints. The first systematic use of fingerprints on a large scale was implemented in India in 1858 in an attempt to stamp out electoral fraud.

The name of the British civil servant who had the idea of using fingerprinting in this way was William Herschel, although I don’t think he was related to the astronomer of the same name.

That would be too much of a coincidence.