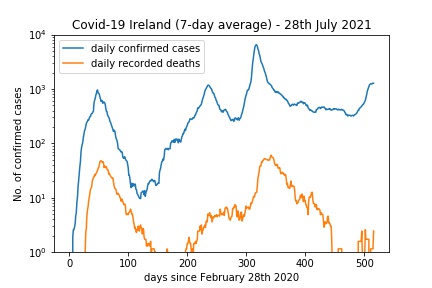
When I was updating my Covid-19 page today I thought I would try something a bit different. Here are the cases and deaths (in the form of 7-day rolling averages) as I usually plot them:

You can see a slight recent downturn – the latest 7-day average of new cases is 4214.3; it has been falling for a few days. A log plot like this shows up the changing ratio between deaths and cases quite well, as in l if you multiply a quantity by a factor that manifests itself as a constant shift upwards or downwards. There is clearly a bigger shift between the orange and blue curves after 500 days than there is, say, between, 300 and 400.
(I don’t think you can read much into the gap between the curves at the beginning (up to around 100 days in) as testing coverage was very poor then so cases were significantly underestimated.
Anyway, to look at this a bit more clearly I plotted the ratio of daily reported deaths to daily confirmed cases over the course of the pandemic. This is the result:

The sharp downward glitches occur whenever the number of reported deaths is zero, as log of zero is minus infinity. The broader downward feature after about 300 days represents the period in January 2021 when cases were climbing but deaths had not caught up. To deal with that I tried plotting the deaths recorded at a particular time divided by the cases two weeks earlier. This is that result:

The spike is still there, but is much decreased in size, suggesting that a two week lag between cases and deaths is a more useful ratio to look at. Note the ratio of deaths to cases is significantly lower from 500 days onwards than it was between 200 and 400 (say), by a factor a bit less than ten.
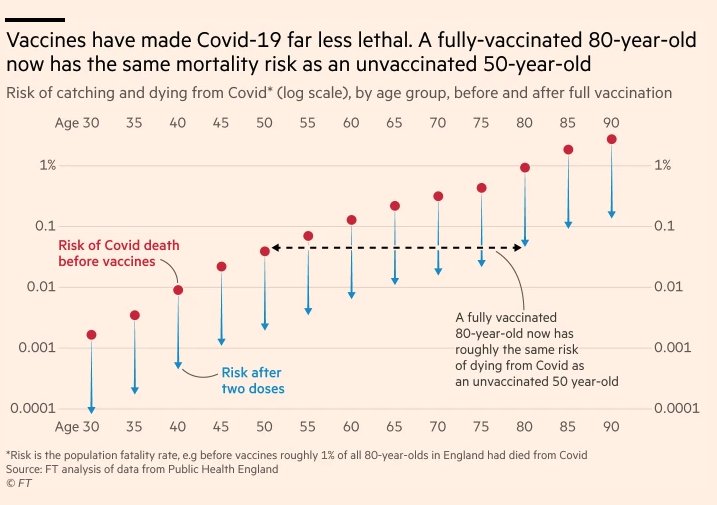
This obviously doesn’t translate into a direct measure of the efficacy of vaccines (not least because many of the recent cases and deaths are among the minority of unvaccinated people in Ireland) but it does demonstrate that there is a vaccine effect. Without them we would be having death rates up to ten times the current level for the same number of daily cases or, more likely, we would be in a strict lockdown.
On the other hand if cases do surge over the Christmas period there will still be a huge problem – 10 % of a large number is not zero.
Follow @telescoper