Archive for the The Universe and Stuff Category

The Map is not the Territory

Posted in History, The Universe and Stuff with tags , , , , , , , , on January 27, 2015 by telescoper

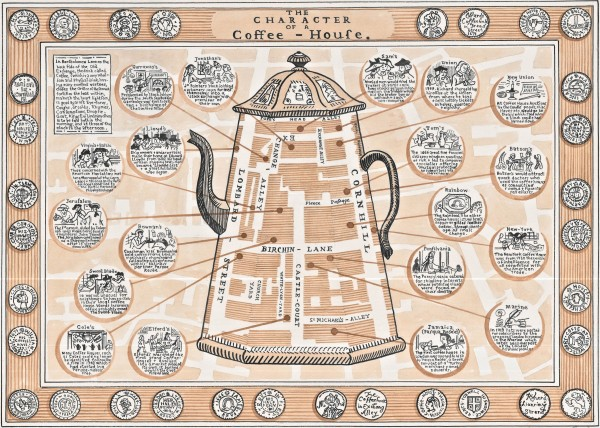
I came across this charming historical map while following one of my favourite Twitter feeds “@Libroantiguo” which publishes fascinating material about books of all kinds, especially old ones. It shows the location of London coffee houses and is itself constructed in the shape of a coffee pot:

Coffee
Although this one is obviously just a bit of fun, maps like this are quite fascinating, not only as practical guides to navigating a transport system but also because they often stand up very well as works of art. It’s also interesting how they evolve with time  because of changes to the network and also changing ideas about stylistic matters.

A familiar example is the London Underground or Tube map. There is a fascinating website depicting the evolutionary history of this famous piece of graphic design. Early versions simply portrayed the railway lines inset into a normal geographical map which made them rather complicated, as the real layout of the lines is far from regular. A geographically accurate depiction of the modern tube network is shown here which makes the point:

tubegeo

A revolution occurred in 1933 when Harry Beck compiled the first “modern” version of the map. His great idea was to simplify the representation of the network around a single unifying feature. To this end he turned the Central Line (in red) into a straight line travelling left to right across the centre of the page, only changing direction at the extremities. All other lines were also distorted to run basically either North-South or East-West and produce a regular pattern, abandoning any attempt to represent the “real” geometry of the system but preserving its topology (i.e. its connectivity).  Here is an early version of his beautiful construction:

Note that although this a “modern” map in terms of how it represents the layout, it does look rather dated in terms of other design elements such as the border and typefaces used. We tend not to notice how much we surround the essential things, which tend to last, with embellishments that date very quickly.

More modern versions of this map that you can get at tube stations and the like rather spoil the idea by introducing a kink in the central line to accommodate the complexity of the interchange between Bank and Monument stations as well as generally buggering about with the predominantly  rectilinear arrangement of the previous design:

I quite often use this map when I’m giving popular talks about physics. I think it illustrates quite nicely some of the philosophical issues related with theoretical representations of nature. I think of theories as being like maps, i.e. as attempts to make a useful representation of some  aspects of external reality. By useful, I mean the things we can use to make tests. However, there is a persistent tendency for some scientists to confuse the theory and the reality it is supposed to describe, especially a tendency to assert there is a one-to-one relationship between all elements of reality and the corresponding elements in the theoretical picture. This confusion was stated most succintly by the Polish scientist Alfred Korzybski in his memorable aphorism :

The map is not the territory.

I see this problem written particularly large with those physicists who persistently identify the landscape of string-theoretical possibilities with a multiverse of physically existing domains in which all these are realised. Of course, the Universe might be like that but it’s by no means clear to me that it has to be. I think we just don’t know what we’re doing well enough to know as much as we like to think we do.

A theory is also surrounded by a penumbra of non-testable elements, including those concepts that we use to translate the mathematical language of physics into everday words. We shouldn’t forget that many equations of physics have survived for a long time, but their interpretation has changed radically over the years.

The inevitable gap that lies between theory and reality does not mean that physics is a useless waste of time, it just means that its scope is limited. The Tube  map is not complete or accurate in all respects, but it’s excellent for what it was made for. Physics goes down the tubes when it loses sight of its key requirement: to be testable.

In any case, an attempt to make a grand unified theory of the London Underground system would no doubt produce a monstrous thing that would be so unwieldly that it would be useless in practice. I think there’s a lesson there for string theorists too…

Now, anyone for a game of Mornington Crescent?


Social Physics & Astronomy

Posted in The Universe and Stuff with tags , , , , , , on January 25, 2015 by telescoper

When I give popular talks about Cosmology,  I sometimes look for appropriate analogies or metaphors in television programmes about forensic science, such as CSI: Crime Scene Investigation which I watch quite regularly (to the disdain of many of my colleagues and friends). Cosmology is methodologically similar to forensic science because it is generally necessary in both these fields to proceed by observation and inference, rather than experiment and deduction: cosmologists have only one Universe;  forensic scientists have only one scene of the crime. They can collect trace evidence, look for fingerprints, establish or falsify alibis, and so on. But they can’t do what a laboratory physicist or chemist would typically try to do: perform a series of similar experimental crimes under slightly different physical conditions. What we have to do in cosmology is the same as what detectives do when pursuing an investigation: make inferences and deductions within the framework of a hypothesis that we continually subject to empirical test. This process carries on until reasonable doubt is exhausted, if that ever happens.

Of course there is much more pressure on detectives to prove guilt than there is on cosmologists to establish the truth about our Cosmos. That’s just as well, because there is still a very great deal we do not know about how the Universe works.I have a feeling that I’ve stretched this analogy to breaking point but at least it provides some kind of excuse for writing about an interesting historical connection between astronomy and forensic science by way of the social sciences.

The gentleman shown in the picture on the left is Lambert Adolphe Jacques Quételet, a Belgian astronomer who lived from 1796 to 1874. His principal research interest was in the field of celestial mechanics. He was also an expert in statistics. In Quételet’s  time it was by no means unusual for astronomers to well-versed in statistics, but he  was exceptionally distinguished in that field. Indeed, Quételet has been called “the father of modern statistics”. and, amongst other things he was responsible for organizing the first ever international conference on statistics in Paris in 1853.

His fame as a statistician owed less to its applications to astronomy, however, than the fact that in 1835 he had written a very influential book which, in English, was titled A Treatise on Man but whose somewhat more verbose original French title included the phrase physique sociale (“social physics”). I don’t think modern social scientists would see much of a connection between what they do and what we do in the physical sciences. Indeed the philosopher Auguste Comte was annoyed that Quételet appropriated the phrase “social physics” because he did not approve of the quantitative statistical-based  approach that it had come to represent. For that reason Comte  ditched the term from his own work and invented the modern subject of  sociology…

Quételet had been struck not only by the regular motions performed by the planets across the sky, but also by the existence of strong patterns in social phenomena, such as suicides and crime. If statistics was essential for understanding the former, should it not be deployed in the study of the latter? Quételet’s first book was an attempt to apply statistical methods to the development of man’s physical and intellectual faculties. His follow-up book Anthropometry, or the Measurement of Different Faculties in Man (1871) carried these ideas further, at the expense of a much clumsier title.

This foray into “social physics” was controversial at the time, for good reason. It also made Quételet extremely famous in his lifetime and his influence became widespread. For example, Francis Galton wrote about the deep impact Quételet had on a person who went on to become extremely famous:

Her statistics were more than a study, they were indeed her religion. For her Quételet was the hero as scientist, and the presentation copy of his “Social Physics” is annotated on every page. Florence Nightingale believed – and in all the actions of her life acted on that belief – that the administrator could only be successful if he were guided by statistical knowledge. The legislator – to say nothing of the politician – too often failed for want of this knowledge. Nay, she went further; she held that the universe – including human communities – was evolving in accordance with a divine plan; that it was man’s business to endeavour to understand this plan and guide his actions in sympathy with it. But to understand God’s thoughts, she held we must study statistics, for these are the measure of His purpose. Thus the study of statistics was for her a religious duty.

The person  in question was of course  Florence Nightingale. Not many people know that she was an adept statistician who was an early advocate of the use of pie charts to represent data graphically; she apparently found them useful when dealing with dim-witted army officers and dimmer-witted politicians.

The type of thinking described in the quote  also spawned a number of highly unsavoury developments in pseudoscience, such as the eugenics movement (in which Galton himself was involved), and some of the vile activities related to it that were carried out in Nazi Germany. But an idea is not responsible for the people who believe in it, and Quételet’s work did lead to many good things, such as the beginnings of forensic science.

A young medical student by the name of Louis-Adolphe Bertillon was excited by the whole idea of “social physics”, to the extent that he found himself imprisoned for his dangerous ideas during the revolution of 1848, along with one of his Professors, Achile Guillard, who later invented the subject of demography, the study of racial groups and regional populations. When they were both released, Bertillon became a close confidante of Guillard and eventually married his daughter Zoé. Their second son, Adolphe Bertillon, turned out to be a prodigy.

Young Adolphe was so inspired by Quételet’s work, which had no doubt been introduced to him by his father, that he hit upon a novel way to solve crimes. He would create a database of measured physical characteristics of convicted criminals. He chose 11 basic measurements, including length and width of head, right ear, forearm, middle and ring fingers, left foot, height, length of trunk, and so on. On their own none of these individual characteristics could be probative, but it ought to be possible to use a large number of different measurements to establish identity with a very high probability. Indeed, after two years’ study, Bertillon reckoned that the chances of two individuals having all 11 measurements in common were about four million to one. He further improved the system by adding photographs, in portrait and from the side, and a note of any special marks, like scars or moles.

Bertillonage, as this system became known, was rather cumbersome but proved highly successful in a number of high-profile criminal cases in Paris. By 1892, Bertillon was exceedingly famous but nowadays the word bertillonage only appears in places like the Observer’s Azed crossword.

The main reason why Bertillon’s fame subsided and his system fell into disuse was the development of an alternative and much simpler method of criminal identification: fingerprints. The first systematic use of fingerprints on a large scale was implemented in India in 1858 in an attempt to stamp out electoral fraud.

The name of the British civil servant who had the idea of using fingerprinting in this way was Sir William James Herschel (1833-1917), the eldest child of Sir John Herschel, the astronomer, and thus the grandson of Sir William Herschel, the discoverer of Uranus. Another interesting connection between astronomy and forensic science.


Last days on the Ice

Posted in The Universe and Stuff with tags , , on January 25, 2015 by telescoper

Earlier this month I reblogged a post about the launch of the balloon-borne SPIDER experiment in Antarctica. Here’s a follow up from last week. Spider parachuted back down to the ice on January 17th and was recovered successfully. Now the team will be leaving the ice and returning home, hopefully with some exciting science results!

I’d love to go to Antarctica, actually. When I was finishing my undergraduate studies at Cambridge I applied for a place on the British Antarctic Survey, but didn’t get accepted. I don’t suppose I’ll get the chance now, but you never know…

annegambrel22's avatarSPIDER on the Ice

Four of the last five of the SPIDER crew– Don, Ed, Sasha, and I– are slated to leave the Ice tomorrow morning. That means this is probably my last blog post– at least until SPIDER 2! It has been an incredible few months, but I can’t say I’m all that sad for it to be ending. I’m ready to have an adventure in New Zealand and then get home to all the people I’ve missed so much while I’ve been away.

As is the nature of field campaigns, it has been an absolute roller coaster, but the highs have certainly made the lows fade in my memory. We got SPIDER on that balloon, and despite all of the complexities and possible points of failure, it worked. That’s a high I won’t be coming down from any time soon.

On top of success with our experiment, we’ve also had the privilege of…

View original post 98 more words

Andromeda in High Resolution

Posted in The Universe and Stuff with tags , , , , , , on January 20, 2015 by telescoper

This afternoon I gave three hours of lectures on the trot, so I’m now feeling more than a little knackered. Before I head home for an early night, though, I thought I’d share this amazing video produced by the Panchromatic Hubble Andromeda Survey (or PHAT, for short), which is a Hubble Space Telescope (HST) Multi-cycle program to map roughly a third of the star-forming disk of the Andromeda Nebula (M31), using 6 filters covering from the ultraviolet through the near infrared. With HST’s resolution and sensitivity, the disk of M31 is resolved into more than 100 million stars. The combination of scale and detail is simply jaw-dropping. Hat’s off to the PHAT team!

Cosmology – Confusion on a Higher Level?

Posted in Biographical, The Universe and Stuff with tags , , , , , on January 19, 2015 by telescoper

I’ve already posted the picture below, which was taken at a conference in Leiden (Netherlands) in 1995. Various shady characters masquerading as “experts” were asked by the audience of graduate students at a summer school to give their favoured values for the cosmological parameters (from top to bottom: the Hubble constant, density parameter, cosmological constant, curvature parameter and age of the Universe).

From left to right we have Alain Blanchard (AB), Bernard Jones (BJ, standing), John Peacock (JP), me (yes, with a beard and a pony tail – the shame of it), Vincent Icke (VI), Rien van de Weygaert (RW) and Peter Katgert (PK, standing). You can see on the blackboard that the only one to get anywhere close to correctly predicting the parameters of what would become the standard cosmological model was, in fact, Rien van de Weygaert.

Well, my excuse for posting this again is the fact that a similar discussion was held at a meeting in Oslo (Norway) at which a panel of experts and Alan Heavens did a similar thing. I wasn’t there myself but grabbed the evidence from facebook:

experts

I’ll leave it as an exercise for the reader to identify the contributors. The 2015 version of the results is considerably more high-tech than the 1995 one, but in case you can’t read what is on the screen here are the responses:

panel_vote

The emphasis here is on possible departures from the standard model, whereas in 1995 the standard model hadn’t yet been established. I’m not sure exactly what questions were asked but I think my answers would have been: 3+1;  maybe; maybe; don’t know but (probably) not CDM; something indistinguishable from GR given current experiments; Lambda; and maybe. I’ve clearly become a skeptic in my old age.

Anyway, this “progress” reminded me of a quote I used to have on my office door when I was a graduate student in the Astronomy Centre at the University of Sussex many years ago:

We have not succeeded in answering all our problems. The answers we have found only serve to raise a whole set of new questions. In some ways we feel we are as confused as ever, but we believe we are confused on a higher level and about more important things.

The attribution of that quote is far from certain, but I was told that it was posted outside the mathematics reading room, Tromsø University. Which is in Norway. Apt, or what?

Lognormality Revisited

Posted in Biographical, Science Politics, The Universe and Stuff with tags , , , , , on January 14, 2015 by telescoper

I was looking up the reference for an old paper of mine on ADS yesterday and was surprised to find that it is continuing to attract citations. Thinking about the paper reminds me off the fun time I had in Copenhagen while it was written.   I was invited there in 1990 by Bernard Jones, who used to work at the Niels Bohr Institute.  I stayed there several weeks over the May/June period which is the best time of year  for Denmark; it’s sufficiently far North (about the same latitude as Aberdeen) that the summer days are very long, and when it’s light until almost midnight it’s very tempting to spend a lot of time out late at night..

As well as being great fun, that little visit also produced what has turned out to be  my most-cited paper. In fact the whole project was conceived, work done, written up and submitted in the space of a couple of months. I’ve never been very good at grabbing citations – I’m more likely to fall off bandwagons rather than jump onto them – but this little paper seems to keep getting citations. It hasn’t got that many by the standards of some papers, but it’s carried on being referred to for almost twenty years, which I’m quite proud of; you can see the citations-per-year statistics even seen to be have increased recently. The model we proposed turned out to be extremely useful in a range of situations, which I suppose accounts for the citation longevity:

lognormal

I don’t think this is my best paper, but it’s definitely the one I had most fun working on. I remember we had the idea of doing something with lognormal distributions over coffee one day,  and just a few weeks later the paper was  finished. In some ways it’s the most simple-minded paper I’ve ever written – and that’s up against some pretty stiff competition – but there you go.

Picture1

The lognormal seemed an interesting idea to explore because it applies to non-linear processes in much the same way as the normal distribution does to linear ones. What I mean is that if you have a quantity Y which is the sum of n independent effects, Y=X1+X2+…+Xn, then the distribution of Y tends to be normal by virtue of the Central Limit Theorem regardless of what the distribution of the Xi is  If, however, the process is multiplicative so  Y=X1×X2×…×Xn then since log Y = log X1 + log X2 + …+log Xn then the Central Limit Theorem tends to make log Y normal, which is what the lognormal distribution means.

The lognormal is a good distribution for things produced by multiplicative processes, such as hierarchical fragmentation or coagulation processes: the distribution of sizes of the pebbles on Brighton beach  is quite a good example. It also crops up quite often in the theory of turbulence.

I’ll mention one other thing  about this distribution, just because it’s fun. The lognormal distribution is an example of a distribution that’s not completely determined by knowledge of its moments. Most people assume that if you know all the moments of a distribution then that has to specify the distribution uniquely, but it ain’t necessarily so.

If you’re wondering why I mentioned citations, it’s because it looks like they’re going to play a big part in the Research Excellence Framework, yet another new bureaucratical exercise to attempt to measure the quality of research done in UK universities. Unfortunately, using citations isn’t straightforward. Different disciplines have hugely different citation rates, for one thing. Should one count self-citations?. Also how do you aportion citations to multi-author papers? Suppose a paper with a thousand citations has 25 authors. Does each of them get the thousand citations, or should each get 1000/25? Or, put it another way, how does a single-author paper with 100 citations compare to a 50 author paper with 101?

Or perhaps the REF panels should use the logarithm of the number of citations instead?

Why was 2014 warm AND wet?

Posted in The Universe and Stuff with tags , , on January 12, 2015 by telescoper

It’s certainly a wet start to 2014 here in Brighton, but did you know that 2014 was the warmest year in the UK since records began as well as one of the wettest?

Michael de Podesta's avatarProtons for Breakfast

Colour-coded Map of UK showing how each region of the UK exceeded the 1981-2010 average temperature. Crown Copyright Colour-coded Map of UK showing how each region of the UK exceeded the 1981-2010 average temperature. Crown Copyright

2014 was the warmest year in the UK ‘since records began’ – and most probably the warmest since at least 1659. You can read the Met Office Summary here

The World Meteorological Organisation (WMO) also report that 2014 is likely to have been the warmest year in Europe and indeed over the entire Earth for at least 100 years.

This was briefly ‘news but somehow this astonishing statistic seems to have disappeared almost without trace.

In fact there are three astonishing things about the statistic

  • Firstly – we know it, and it is likely to be correct.
  • Secondly – the warmest year was ‘warmer all over’ but did not include the ‘hottest month’.
  • Thirdly- the warmest year was also overly wet – both in the UK and world wide.

This article is about why

View original post 519 more words

Hubble + Beethoven

Posted in Music, The Universe and Stuff with tags , , on January 10, 2015 by telescoper

In an attempt to get away from the horrors of the last few days I thought I’d offer this video I just found on Youtube. It features majestic, life-affirming music from the 2nd Movement of Beethoven’s Symphony No. 7 in A Major along with some wonderful astronomical images from the Hubble Space Telescope. Science and art for all humanity. How pathetic our petty squabbles appear when we think about the Universe or listen to great music.

The Durham YETI

Posted in Talks and Reviews, The Universe and Stuff with tags , , , , on January 9, 2015 by telescoper

On Wednesday afternoon, after an important meeting that took up most of the morning, I headed off my train to Durham. Unusually by the standards of my recent experiences of railways, the trip went smoothly and I arrived on time. The cathedral was looking rather spectral when I arrived:

Durham

The occasion of my vist was the Young Experimentalists and Theorists Institute (YETI for short), a gathering of early career particle physicists, mainly graduate students. I was scheduled to give a 90-minute lecture on Cosmic Microwave Background Theory to the 40-50 folks attending the workshop. It was nice to get the chance to get away from budgets and spreadsheets for a time and talk about cosmology, and it was an interesting audience different from the usual more specialist crowd I get to talk to at graduate workshops. It’s good, especially for beginning research students, to find out about subjects outside their immediate research topic and I’m glad the YETI organizers appreciate that. On the other hand, CMB theory is a huge topic so it was difficult to decide what to put in and what to leave out.

Incidentally, 2015 sees the 50th anniversary of the discovery of the Cosmic Microwave Background, and with yet more exciting results due out soon I’m sure the CMB will be in the news a lot this year.

I spent Wednesday night at Collingwood College, where the conference delegates were accommodated, and gave my 90-minute talk, starting at 9am yesterday morning, paused for quick cup of coffee and then legged it back to Durham station for the return journey back to Brighton. It’s a pity I didn’t get the chance to stay longer, especially because the second speaker of the morning, on CMB Observations, was Jo Dunkley of Oxford University who this afternoon is giving a talk at the Royal Astronomical Society because she has just been awarded the Society’s Fowler Prize. I can’t attend that meeting because of work commitments either. Sigh.

The train journey back to Brighton went smoothly and on time too. Wonders never cease!

Anyway, thanks to the organizers of YETI for inviting me. I hope the talk was reasonably comprehensible. Apologies to my other friends at Durham for not hanging around, but I really didn’t have time to stop for a natter or, more importantly, a beer or several.

Faster Than The Speed of Light?

Posted in The Universe and Stuff with tags , , , , , on January 5, 2015 by telescoper

Back to the office after starting out early to make the long journey back to Brighton from Cardiff, all of which went smoothly for a change. I’ve managed to clear some of the jobs waiting for me on my return from the Christmas holidays so thought I’d take my lunch break and write a quick blog post. I hasten to add, however, that the title isn’t connected in any way with the speed of this morning’s train, which never at any point threatened causality.

What spurred me on to write this piece was an exchange on Twitter, featuring the inestimable Sean Carroll who delights in getting people to suggest physics for him to explain in fewer than three tweets. It’s a tough job sometimes, but he usually does it brilliantly. Anyway, the third of his tweets about the size of the (observable universe), and my rather pedantic reply to it, both posted on New Year’s Day, were as follows:

I thought I’d take the opportunity to explain in a little bit more detail how and why it can be that the size of the observable universe is significantly larger than what one naively imagine, i.e. (the speed of light) ×(time elapsed since the Big Bang) = ct, for short. I’ve been asked about this before but never really had the time to respond.

Let’s start with some basic cosmological concepts which, though very familar, lead to some quite surprising conclusions.  First of all, consider the Hubble law, which I will write in the form

v=HR

It’s not sufficiently widely appreciated that for a suitable definition of the recession velocity v and distance R, this expression is exact for any velocity, even one much greater than the speed of light! This doesn’t violate any principle of relativity as long as one is careful with the definition.

Let’s start with time. The assumption of the Cosmological Principle, that the Universe is homogeneous and isotropic on large scales, furnishes a preferred time coordinate, usually called cosmoloogical proper time, or cosmic time, defined in such a way that observers in different locations can set their clocks according to the local density of matter. This allows us to slice the four-dimensional space-time of the Universe into three spatial dimensions of one dimension of time in a particularly elegant way.

The geometry of space-time can now be expressed in terms of the Robertson-Walker metric. To avoid unnecessary complications, and because it seems to be how are Universe is, as far as we can tell, I’ll restrict myself to the case where the spatial sections are flat (ie they have Euclidean geometry). This the metric is:

ds^{2}=c^{2}dt^{2} - a^{2}(t) \left[ d{r}^2 + r^{2}d\Omega^{2} \right]

Where s is a four-dimensional interval t is cosmological proper time as defined above, r is a radial coordinate and \Omega defines angular position (the observer is assumed to be at the origin). The function a(t) is called the cosmic scale factor, and it describes the time-evolution of the spatial part of the metric; the coordinate r of an object moving with the cosmic expansion does not change with time, but the proper distance of such an object evolves according to

R=a(t)r

The name “proper” here relates to the fact that this definition of distance corresponds to an interval defined instantaneously (ie one with dt=0). We can’t actually measure such intervals; the best we can do is measure things using signals of some sort, but the notion is very useful in keeping the equations simple and it is perfectly well-defined as long as you stay aware of what it does and does not mean. The other thing we need to know is that the Big Bang is supposed to have happened at dt=0 at which point a(t)=0 too.


If we now define the proper velocity of an object comoving with the expansion of the Universe to be

v=\frac{dR}{dt}=\left(\frac{da}{dt} \right)r = \left(\frac{\dot{a}}{a}\right) R = HR

This is the form of the Hubble law that applies for any velocity and any distance. That does not mean, however, that one can work out the redshift of a source by plugging this velocity into the usual Doppler formula, for reasons that I hope will become obvious.

The specific case ds=0 is what we need here, as that describes the path of a light ray (null geodesic); if we only follow light rays travelling radially towards or away from the origin, the former being of greatest relevance to observational cosmology, then we can set d\Omega=0 too and find:

dr =\frac{cdt}{a(t)}

Now to the nub of it. How do we define the size of the observable universe? The best way to answer this is in terms of the particle horizon which, in a nutshell, is defined so that a particle on the particle horizon at the present cosmic time is the most distant object that an observer at the origin can ever have received a light signal from in the entire history of the Universe. The horizon in Robertson-Walker geometry will be a sphere, centred on the origin, with some coordinate radius. The radius of this horizon will increase in time, in a manner that can be calculated by integrating the previous expression from t=0 to t=t_0, the current age of the Universe:

r_p(t_0)=\int_{0}^{t_0} \frac{cdt}{a(t)}.

For any old cosmological model this has to be integrated by solving for the denominator as a function of time using the Friedmann equations, usually numerically. However, there is a special case we can do trivially which demonstrates all the salient points. The matter-dominated Einstein- de Sitter model is flat and has the solution

a(t)\propto t^{2/3}

so that

\frac{a(t)}{a(t_0)} = \left(\frac{t}{t_0}\right)^{2/3}

Plugging this into the integral and using the above definitions we find that in this model the present proper distance of an object on our particle horizon is

R_p = 3ct_{0}


By the way, some cosmologists prefer to use a different definition of the horizon, called the Hubble sphere. This is the sphere on which objects are moving away from the observer according to the Hubble law at exactly the velocity of light. For the Einstein-de Sitter cosmology the Hubble parameter is easily found

H(t)=\frac{2}{3t} \rightarrow R_{c}= \frac{3}{2} ct_{0}.

Notice that velocities in this model are always decaying, so in it the expansion is not accelerating but decelerating, hence my comment on Twitter above. The apparent paradox therefore has nothing to do with acceleration, although the particle horizon does get a bit bigger in models with, e.g., a cosmological constant in which the expansion accelerates at late times. In the current standard cosmological model the radius of the particle horizon is about 46 billion light years for an age of 13.7 billion years, which is just 10% larger than in the Einstein de Sitter case.

There is no real contradiction with relativity here because the structure of the metric encodes all the requirements of causality. It is true that there are objects moving away from the origin at proper velocities faster than that of light, but we can’t make instantaneous measurements of cosmological distances; what we observe is their redshifted light. In other words we can’t make measurements of intervals with dt=0 we have to use light rays, which follow paths with ds=0, i.e. we have to make observations down our past light cone. Nevertheless, there are superluminal velocities, in the sense I have defined them above, in standard cosmological models. Indeed, these velocities all diverge at t =0. Blame it all on the singularity!

This figure made by Mark Whittle (University of Virginia) shows our past light cone in the present standard cosmological model:

t16_three_distances_4

If you were expectin the past light cone to look triangular in cross-section then you’re probably thinking of Minkowski space, or a representation involving coordinates chosen to resemble Minkowski space. Cosmological If you look at the left hand side of the figure, you will find the world lines of particles moving with the cosmic expansion labelled by their present proper distance which is obtained by extrapolating the dotted lines until they intersect a line parallel to the x-axis running through “Here & Now”.  Where we actually see these objects is not at their present proper distance but at the point in space-time where their world line intersects the past light cone.  You will see that an object on the particle horizon intersected our past light cone right at the bottom of the figure.

So why does the light cone look so peculiar? Well, I think the simplest way to explain it is to say that while the spatial sections in this model are flat (Euclidean) the four-dimensional geometry is most definitely curved. You can think of the bending of light rays shown in the figure as a kind of gravitational lensing effect due to all the matter in the Universe. I’d say that the fact that the particle horizon has a radius larger than ct is not because of acceleration but the curvature of space-time, an assertion consistent with the fact that the only familiar world model in which this effect does not occur is the (empty) purely kinemetic Milne cosmology, which is based entirely on special relativity.