I’ve just arrived in Dublin after the last regular mid-week flight I’ll have to make from Cardiff because of teaching commitments. Last lecture of term in Maynooth tomorrow, and after that I can be more flexible about the travel.
I’ve generally avoided evening flights since the introduction of the summer schedules. Budget airlines such as FlyBe work on very tight schedules and delays tend to accumulate throughout the day, meaning that incoming planes needed to make evening flights are frequently very late. Sometimes they get so late the plane can’t fly because of restrictions on night flights, in which case they are cancelled. This is much less likely with an earlier flight in my experience.
So I took a chance this evening but as it happened there were no delays I got safely on the bus to Maynooth and got to my flight at a reasonable hour. The plane, by the way, was only about a quarter full.
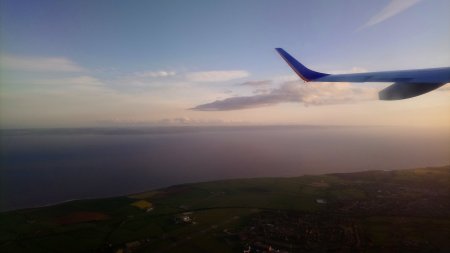
The picture was taken shortly after takeoff from Cardiff Airport, with South Wales underneath and Devon in the distance.
Last week when I wrote about the 2nd Data Release from Gaia, somebody emailed me to ask whether the new results said anything about the cosmological distance ladder and hence the Hubble Constant. As far as I could see, no scientific papers were released on this topic at the time and I thought there probably wasn’t anything definitive at this stage. However, it turns out that there is a paper now, by Riess et al., which focuses on the likely impact of Gaia on the Cepheid distance scale. Here is the abstract:
We present HST photometry of a selected sample of 50 long-period, low-extinction Milky Way Cepheids measured on the same WFC3 F555W, F814W, and F160W-band photometric system as extragalactic Cepheids in SN Ia hosts. These bright Cepheids were observed with the WFC3 spatial scanning mode in the optical and near-infrared to mitigate saturation and reduce pixel-to-pixel calibration errors to reach a mean photometric error of 5 millimags per observation. We use the new Gaia DR2 parallaxes and HST photometry to simultaneously constrain the cosmic distance scale and to measure the DR2 parallax zeropoint offset appropriate for Cepheids. We find a value for the zeropoint offset of -46 +/- 13 muas or +/- 6 muas for a fixed distance scale, higher than found from quasars, as expected, for these brighter and redder sources. The precision of the distance scale from DR2 has been reduced by a factor of 2.5 due to the need to independently determine the parallax offset. The best fit distance scale is 1.006 +/- 0.033, relative to the scale from Riess et al 2016 with H0=73.24 km/s/Mpc used to predict the parallaxes photometrically, and is inconsistent with the scale needed to match the Planck 2016 CMB data combined with LCDM at the 2.9 sigma confidence level (99.6%). At 96.5% confidence we find that the formal DR2 errors may be underestimated as indicated. We identify additional error associated with the use of augmented Cepheid samples utilizing ground-based photometry and discuss their likely origins. Including the DR2 parallaxes with all prior distance ladder data raises the current tension between the late and early Universe route to the Hubble constant to 3.8 sigma (99.99 %). With the final expected precision from Gaia, the sample of 50 Cepheids with HST photometry will limit to 0.5% the contribution of the first rung of the distance ladder to the uncertainty in the Hubble constant.
So, nothing definitive yet but potentially very interesting in the future and this group, led by Adam Riess, is now claiming a 3.8σ tension between measurements of the Hubble constant from cosmic microwave background measurements and from traditional `distance ladder’ approaches, though to my mind this is based on some rather subjective judgements.
The appearance of that paper reminded me that I forgot to post about a paper by Bernal & Peacock that appeared a couple of months ago. Here is the abstract of that one:
When combining data sets to perform parameter inference, the results will be unreliable if there are unknown systematics in data or models. Here we introduce a flexible methodology, BACCUS: BAyesian Conservative Constraints and Unknown Systematics, which deals in a conservative way with the problem of data combination, for any degree of tension between experiments. We introduce hyperparameters that describe a bias in each model parameter for each class of experiments. A conservative posterior for the model parameters is then obtained by marginalization both over these unknown shifts and over the width of their prior. We contrast this approach with an existing hyperparameter method in which each individual likelihood is scaled, comparing the performance of each approach and their combination in application to some idealized models. Using only these rescaling hyperparameters is not a suitable approach for the current observational situation, in which internal null tests of the errors are passed, and yet different experiments prefer models that are in poor agreement. The possible existence of large shift systematics cannot be constrained with a small number of data sets, leading to extended tails on the conservative posterior distributions. We illustrate our method with the case of the H0 tension between results from the cosmic distance ladder and physical measurements that rely on the standard cosmological model.
This paper addresses the long-running issue of apparent tension in different measurements of the Hubble constant that I’ve blogged about before (e.g. here) by putting the treatment of possible systematic errors into a more rigorus and consistent (i.e. Bayesian) form. It says what I think most people in the community privately think about this issue, i.e. that it’s probably down to some sort of unidentified systematic rather than exotic physics.
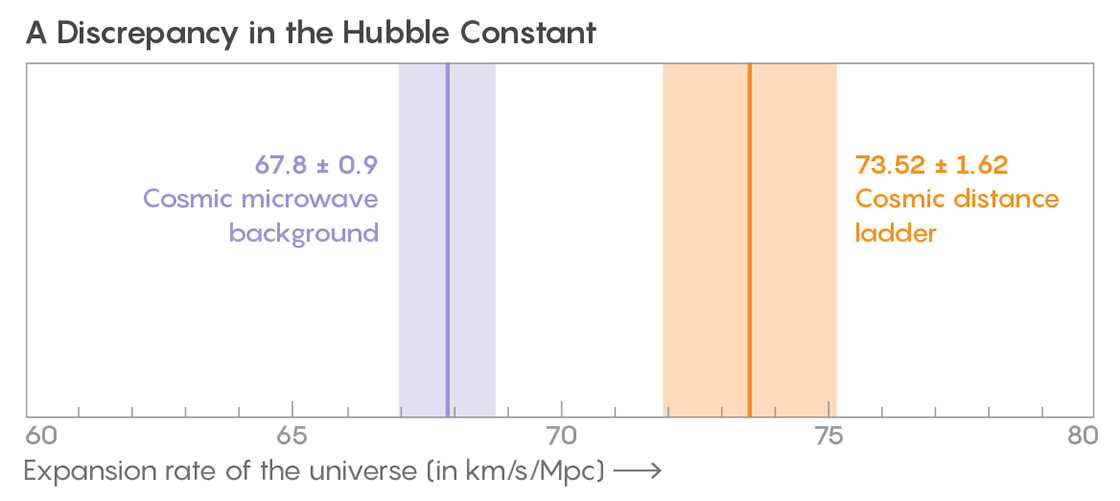
The title of the paper includes the phrase `Conservative Cosmology’, but I think that’s a bit of a misnomer. I think `Sensible Cosmology’. Current events suggest `conservative’ and `sensible’ have opposite meanings. You can find a popular account of it here, from which I have stolen this illustration of the tension:
A chart showing the two differing results for the Hubble constant – The expansion rate of the universe (in km/s/Mpc) Result 1: 67.8 ± 0.9 Cosmic microwave background Result 2: 73.52 ± 1.62 Cosmic distance ladder
Anyway, I have a poll that has been going on for some time about whether this tension is anything to be excited about, so why not use this opportunity cast your vote?
Yesterday in the Data Innovation Research Institute we held a special event, our first ever Conference for Research Software Engineers. Sadly I was too busy yesterday to attend in person, but I did turn up at the end for the drinks reception at the end.
In case you weren’t aware, the term Research Software Engineer (RSE) is applied to the growing number of people in universities and other research organisations who combine expertise in programming with an intricate understanding of research. Although this combination of skills is extremely valuable, these people lack a formal place in the academic system. Without a name, it is difficult for people to rally around a cause, hence the creation of the term Research Software Engineer and the Research Software Engineer Association.
We have quite a few RSEs associated with the Data Innovation Research Institute in Cardiff – as you can see here. These are quite different from system administrators or other computing support staff as they are involved directly in research, working in teams alongside academics and other specialists.
One of the biggest problems facing RSEs in the UK university system is there isn’t a well-established promotions route for them. For researchers in an academic environment, performance is usually judged through publications, PhD students supervised, grants awarded and so so. Although RSEs play a vital role, especially (but not exclusively) in large collaborations, they do not usually end up as lead authors on papers and generally do not apply for grants in their own name. That means that if they are judged by these criteria they struggle to get promotion and often leave academia to work for higher pay and better terms and conditions elsewhere.
In my opinion, one of the important things that must be done to improve the lot of Research Software Engineers is to construct a career structure in parallel with the academic route and other grades (such as laboratory technician) but judged by more appropriate criteria tailored to the reality of the job. Writing the necessary grade profiles and getting them agreed by the relevant university committees will take some time, but I think it will pay dividends in terms of better retention and job satisfaction for these highly talented people.
I hope Cardiff can take some sort of a lead in defining the role of an RSE, but this is really a national need. There are pretty uniform grade descriptions for academic and research staff across the United Kingdom so I don’t see any reason why this can’t be the case for Research Software Engineers. They are vital to many research fields already, and their importance can only grow in the future.
As a member of Glamorgan County Cricket Club I today received some important news by email.
It seems that at the end of this month (ie today), the sponsorship deal with an electricity company that involved the cricket ground in Cardiff being called the SSE SWALEC Stadium lapses.
From tomorrow, the First of May, therefore, the ground will be known by the far more attractive name of Sophia Gardens Cardiff. That also happens to be the name by which it was known from 1967 to 2007…
I have to admit that I always struggled to bring myself to call it the SSE SWALEC Stadium, so I’m glad that I no longer have to try!
And while we’re on about gardens here is a picture of some flowers I saw in Cathays Park on my way to work this morning.
When I got back home after yesterday’s concert, I ate some dinner and settled down to have a look through the Sunday papers. Most of the news was as grim as expected, especially the ongoing fiasco of Brexit, and the scandal engulfing Home Secretary former Home Secretary Amber Rudd who obviously lied to Parliament on at least one occasion. Anyway, turning my attention to the Sports pages there was a write-up of Saturday’s disappointing home defeat for Newcastle United against bottom club West Bromwich Albion. I was gloomy enough to wonder whether Newcastle might actually still get relegated, so looked at the Premiership Table:
Neither West Brom (28 points) nor Stoke (30) can catch Newcastle with only two games to play, but Southampton can in principle get 41 points from here if they win all three games. It’s true that they have a worse goal difference but if Newcastle lost all their three remaining games, and Southampton won all theirs that would change. It therefore looks mathematically possible for Newcastle to be relegated.
However, I then glanced at the fixture list and found that Southampton have to play Swansea in one of their remaining matches. If Southampton win that fixture then the maximum number of points Swansea can get by the end of the competition is 39, so Newcastle can’t be relegated. If Southampton lose or it’s a draw then they can’t catch Newcastle.
I conclude, therefore, that Newcastle United are mathematically safe from relegation. Hooray!
But who will go down? I think West Brom and Stoke will probably get relegated, but I’m not sure about the third team. Huddersfield must be very nervous because their recent form has been poor and they have a very bad goal difference. The betting odds are interesting: BetFred are offering 200/1 on West Brom not being relegated and most bookies are about 8/1 on Stoke to stay up. PaddyPower are quoting 4/9 on Huddersfield and even money on Southampton to go down. If you want to bet on Brighton to get relegated your best odds are with BetVictor who are offering 50-1. Few bookies are quoting odds on West Brom to get relegated, so they obviously think that’s the likely outcome.
I expect these odds to change a lot after the next round of matches.
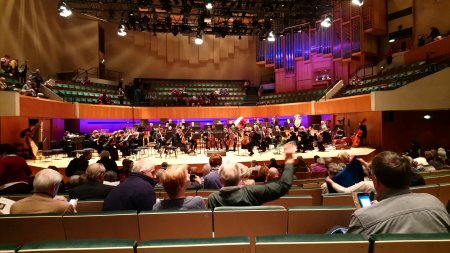
This afternoon found me once again at St David’s Hall, Cardiff, waiting for a concert to start.
This time it was the Orchestra of Welsh National Opera under the direction of Tomáš Hanus. And very enjoyable it was.
The first number was a bit of a taster for the forthcoming WNO season, which includes Prokofiev’s War and Peace and Rossini’s Lá Cenerentola. The latter being the story of Cinderella, it made sense to include Prokofiev’s Cinderella Suite from the ballet he wrote in the 1940s.
After that we had the evergreen Grieg’s Piano Concerto, by Grieg, played by the excellent Peter Donohoe, exactly how I like it: with all the right notes in the right order, and the Orchestra not too heavy on the banjoes.
Following the wine break we had Beethoven’s Symphony No. 7, a work which has to be one of his most uplifting pieces. Beethoven was very good at ‘uplifting’ so that means it is very special indeed.
A lovely concert, warmly received by the audience and a very pleasant way to spend a Sunday afternoon.
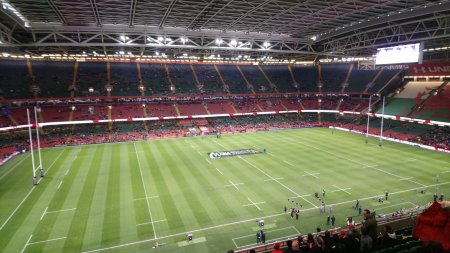
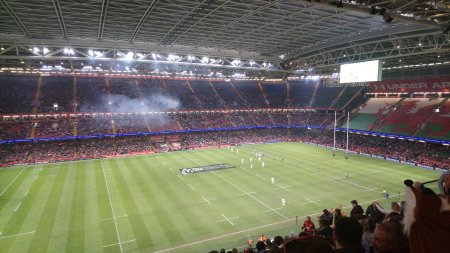
I’m up early again on a Saturday, travelling back to Cardiff this weekend for the above event later today. It’s actually a School social event for members of the School of Physics & Astronomy that involves two rugby matches at the Principality Stadium in Cardiff, featuring all four Welsh teams in the Guinness Pro 14 tournament: the Blues (from Cardiff); Ospreys (from Neath/Swansea); Scarlets (from Llanelli); and Dragons (from Newport). Tickets for the whole event cost just £10 each…
Should be a good day out! I may post a few pictures from the Stadium, so watch this space.
The scene about 20 minutes before Scarlets v Dragons..
It did fill up: the overall attendance was over 65,000.
The Scarlets versus Dragons match was rather one-sided, ending 33-8 to the team from Llanelli. The thing that struck me most about the game was the dire state of the scrummaging. I think only one scrum completely properly in the whole match! The Dragons also conceded a penalty try after repeated infringements at scrums under their own posts.
After a break we had the Ospreys versus Cardiff Blues. Here is the scene shortly after kick off with the Blues (right) immediately under pressure from the Ospreys (left, in white).
After the first 10 minutes I thought the Ospreys were going to run away with the game but it turned out to be an excellent close-fought contest, of much higher quality than the first. Cardiff were actually ahead for much of the game, despite their atrocious performance at the line out. The match ended 26-23 to the Ospreys, with the winning points coming from a drop goal 2 minutes from the end…
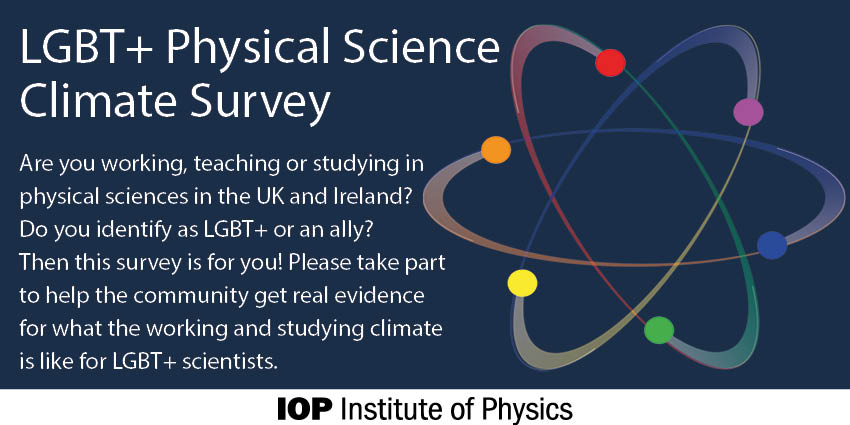
This morning, a tweet from the Institute of Physics containing the above image reminded me to remind you all to participate (if you are so minded) in the LGBT+ Physical Sciences climate survey, which was launched amid the snows of 1st March this year. The deadline is coming up so if you want to complete the survey form and haven’t yet done so, please get on with it!
The survey is open to anyone (whether a member of a professional organisations or not) who identifies as LGBT+ or an ally and who may be working, teaching or studying in a physical sciences field. Respondents will need to be at least 16 years of age and above. The Institute of Physics (IOP), Royal Astronomical Society (RAS) and Royal Society of Chemistry (RSC) are managing this survey on behalf of the LGBT+ Physical Sciences Network. Its aim is to collect evidence for what the working and studying climate is like for LGBT+ physical scientists in the UK and Ireland.
It seems like only yesterday that I was blogging excitedly about the first release of data (DR1) from the European Space Agency’s Gaia Mission. In fact it was way back in 2016! Anyway, yesterday came another glut of Gaia goodness in the form of the second release of data, known to its friends as DR2.
In case you weren’t aware, Gaia is an ambitious space mission to chart a three-dimensional map of our Galaxy, the Milky Way, in the process revealing the composition, formation and evolution of the Galaxy. Gaia will provide unprecedented positional and radial velocity measurements with the accuracy needed to produce a stereoscopic and kinematic census of about one billion stars in our Galaxy and throughout the Local Group. This amounts to about 1 per cent of the Galactic stellar population.
You can find links to all the DR2 science papers here, a guide to how to use the data here, and of course a link to the full Gaia Archive here.
Here’s a (brief!) list of the contents of DR2:
The five-parameter astrometric solution – positions on the sky (α, δ), parallaxes, and proper motions – for more than 1.3 billion (109) sources, with a limiting magnitude of G = 21 and a bright limit of G ≈ 3. Parallax uncertainties are in the range of up to 0.04 milliarcsecond for sources at G < 15, around 0.1 mas for sources with G=17 and at the faint end, the uncertainty is of the order of 0.7 mas at G = 20. The corresponding uncertainties in the respective proper motion components are up to 0.06 mas yr-1 (for G < 15 mag), 0.2 mas yr-1 (for G = 17 mag) and 1.2 mas yr-1 (for G = 20 mag). The Gaia DR2 parallaxes and proper motions are based only on Gaia data; they do no longer depend on the Tycho-2 Catalogue.
Median radial velocities (i.e. the median value over the epochs) for more than 7.2 million stars with a mean G magnitude between about 4 and 13 and an effective temperature (Teff) in the range of about 3550 to 6900 K. This leads to a full six-parameter solution: positions and motions on the sky with parallaxes and radial velocities, all combined with mean G magnitudes. The overall precision of the radial velocities at the bright end is in the order of 200-300 m s-1 while at the faint end the overall precision is approximately 1.2 km s-1 for a Teff of 4750 K and about 2.5 km s-1 for a Teff of 6500 K.
An additional set of more than 361 million sources for which a two-parameter solution is available: the positions on the sky (α, δ) combined with the mean G magnitude. These sources have a positional uncertainty at G=20 of about 2 mas, at J2015.5.
G magnitudes for more than 1.69 billion sources, with precisions varying from around 1 milli-mag at the bright (G<13) end to around 20 milli-mag at G=20. Please be aware that the photometric system for the G band in Gaia DR2 is different from the photometric system as used in Gaia DR1.
GBP and GRP magnitudes for more than 1.38 billion sources, with precisions varying from a few milli-mag at the bright (G<13) end to around 200 milli-mag at G=20.
Full passband definitions for G, BP and RP. These passbands are now available for download.
Epoch astrometry for 14,099 known solar system objects based on more than 1.5 million CCD observations. 96% of the along-scan (AL) residuals are in the range -5 to 5 mas, and 52% of the AL residuals are in the range of -1 to 1 mas. The transit observations are part of Gaia DR2 and have also been delivered to the Minor Planet Center (MPC).
Subject to limitations (see below) the effective temperatures Teff for more than 161 million sources brighter than 17th magnitude with effective temperatures in the range 3000 to 10,000 K. For a subset of about 87 million sources also the line-of-sight extinction AG and reddening E(BP-RP) are given and for a part of this subset (around 76 million sources) the luminosity and radius are available as well.
Classifications for more than 550,000 variable sources consisting of Cepheids, RR Lyrae, Mira and Semi-Regular Candidates as well as High-Amplitude Delta Scuti, BY Draconis candidates, SX Phoenicis Candidates and short time scale phenomena.
Planned cross-matches between Gaia DR2 sources on the one hand and Hipparcos-2, Tycho-2, 2MASS PSC, SDSS DR9, Pan-STARRS1, GSC2.3, PPM-XL, AllWISE, and URAT-1 data on the other hand.
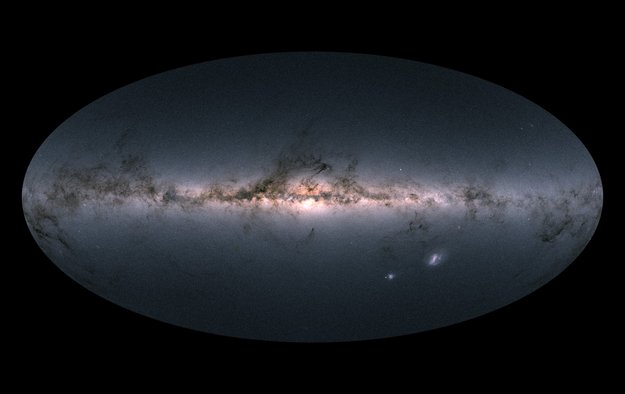
There’s much more to Gaia than pictures, but here’s a map of the stars in our galaxy to give you an idea:
I remember first hearing about Gaia about 17 years ago when I was on a PPARC advisory panel and was immediately amazed by the ambition of its objectives. As I mentioned above, Gaia is a global space astrometry mission, which will make the largest, most precise three-dimensional map of our Galaxy by surveying more than a billion stars. In some sense Gaia is the descendant of the Hipparcos mission launched in 1989, but it’s very much more than that. Gaia monitors each of its target stars about 70 times over a five-year period. It is expected to discover hundreds of thousands of new celestial objects, such as extra-solar planets and brown dwarfs, and observe hundreds of thousands of asteroids within our own Solar System. The mission is also expected to yield a wide variety of other benefits, including new tests of the General Theory of Relativity.
For the brighter objects, i.e. those brighter than magnitude 15, Gaia measures their positions to an accuracy of 24 microarcseconds, comparable to measuring the diameter of a human hair at a distance of 1000 km. Distances of relatively nearby stars are measured to an accuracy of 0.001%. Even stars near the Galactic Centre, some 30,000 light-years away, have their distances measured to within an accuracy of 20%.
It’s an astonishing mission that will leave an unbelievably rich legacy not only for the astronomers working on the front-line operations of Gaia but for generations to come.
The views presented here are personal and not necessarily those of my employer (or anyone else for that matter).
Feel free to comment on any of the posts on this blog but comments may be moderated; anonymous comments and any considered by me to be vexatious and/or abusive and/or defamatory will not be accepted. I do not necessarily endorse, support, sanction, encourage, verify or agree with the opinions or statements of any information or other content in the comments on this site and do not in any way guarantee their accuracy or reliability.