Rummaging through my drawers just now I found the General Paper I took in 1981 to get into Cambridge. I haven’t copied Section A, which involves writing a precis of a rather lengthy article about voting systems, but Sections B and C involve different forms of writing challenge.
I don’t remember which questions I answered, but most of the topics are still interesting and/or controversial enough to be topics for a blog post, at least. Which would you have chosen?
Incidentally, the whole paper was of 3 hours duration and all sections were equally weighted so you would be expected to spend about an hour on each question.
I think we should do much more to encourage science students to develop their writing skills nowadays. I think most present-day physics would find these exercises very difficult, simply because they don’t get enough practice at putting pen to paper (or even fingers to keyboard).
If you are feeling keen, and have an hour to spare, feel free to submit a piece through the comments box!
I chanced upon this old picture just now. It was taken in Brighton in 1989, and it shows me with Maurice, a gorgeous Burmese cat who was a resident of the basement flat in which I lodged for a while, in Montpelier Terrace. This photograph was taken in the little yard at the rear of the property, from which Maurice frequently tried to escape.
Burmese are wonderful cats, very talkative and full of personality, but their claws are like needles!
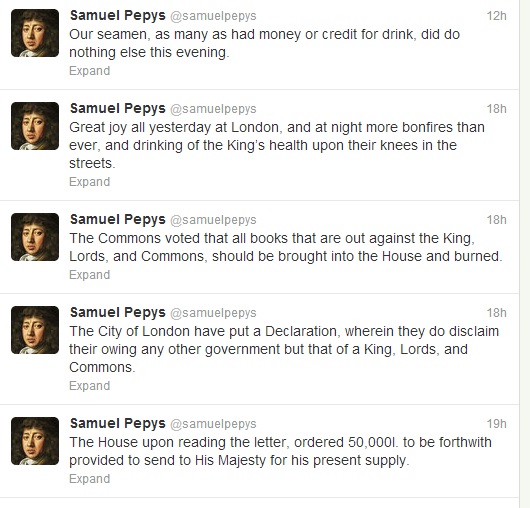
Twitter is much maligned by those who don’t use it, and I’d be the first to admit that it has several million downsides, but every now and again you come across something truly wonderful which makes it worthwhile putting up with the dross. Here’s an example. Some time ago, a nameless genius came up with the idea of tweeting excerpts from the Diaries of Samuel Pepys. Those of you on Twitter can follow Samuel Pepys by clicking here:
For those of you not familiar with Twitter, its main characteristic is that messages posted on it (“tweets”) are limited to 140 characters. To outsiders this seems to imply that all tweets are banal and pointless, but this is far from the case. The strict length limit forces a form of creativity that is both rare and wonderful. The stroke of genius in this case was to realize that the Pepys Diaries could be tweeted in chunks of the right size, in a manner that almost suggests they were designed for the purpose!
Pepys was a high-ranking naval administrator and Member of Parliament so he had detailed knowledge of the momentous political events of his period. He’s currently tweeting from May 1660 (near the start of the diaries), giving a vivid insight into the background to the Restoration of the Monarchy. Parliament should be recalled in a few days time, on May 8th…
Here is a selection of recent examples:
But it’s not just the fascinating political context that makes these tweets so interesting. They also give glimpses of everyday life in the 17th Century. Pepys was in poor health for much of his life, for example, and there are frequent references to various physicians and their quack remedies. He also manages to conjure up in just a few words the extraordinary atmosphere and energy of the London of the period, along with some of its excesses (especially drinking and fornication).
Following Pepys’ Twitter feed opens a window into 17th Century England, and what comes through it is both refreshing and illuminating. The reason I find this particularly delightful is something that I’ve blogged about before, so won’t repeat at length. I was a very late developer from an education point of view until I was helped with my reading and arithmetic by a wonderful old lady who lived next door. She encouraged me to read and, after a big struggle, I eventually got the hang of it. After a time I had caught up with the rest of the class in School and eventually managed to read just about every book the School had to offer, including the Diaries of Samuel Pepys which were for some reason on the shelves in Class 2 and which I was allowed to borrow. I don’t think anyone had read them before so nobody, including the teachers, knew how rude they were in places. The Restoration period was generally rather bawdy, and Pepys’ Diaries reflect that.
I had no idea at that time, of course, that less than ten years later I would be studying at Magdalene College, Cambridge, site of the Pepys Library where the orignal diaries are kept as well as the rest of Pepys’ own collection of rare books and music.
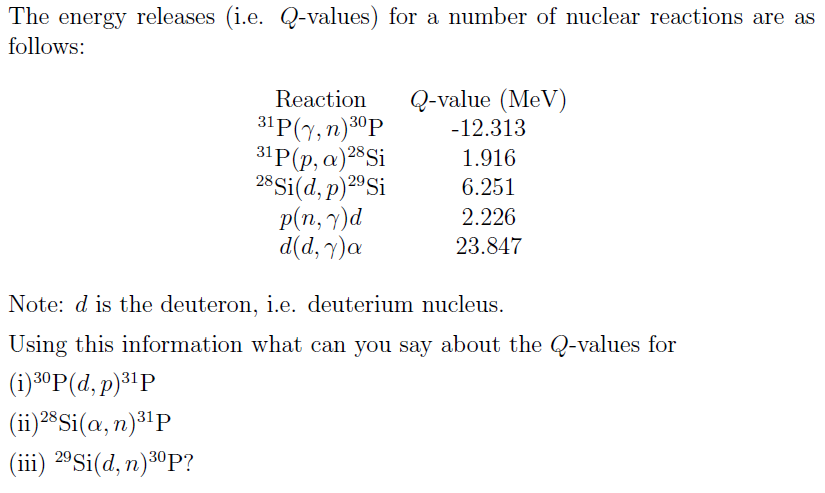
It’s been quite a while since I posted anything in the cute physics problems folder – mostly because the problems I’m generally dealing with these days are neither cute nor related to physics – but here’s one from an old course I used to teach on Nuclear and Particle Physics.
In the following the notation A(a,b)B means the reaction a+A→b+B and the you might want to look here for a definition of what a Q-value is. The Atomic Number of Phosphorus (P) is 15, and that of Silicon (Si) is 14. The question doesn’t require any complicated mathematics, or any knowledge of physics beyond A-level; the rest is up to your little grey cells!
This song was playing on the radio in the Bridge Cafe just now when I went to get a cup of coffee, thus providing me with another time warp experience. The Communards’ version of Don’t Leave Me This Way was a big hit way back in 1986 and I remember dancing to it many times in various Brighton clubs and discos; I was here at the University of Sussex then as a research student. Can that really have been 27 years ago? Sigh…
It’s another very busy day (as well as another lovely one) so I thought instead of sitting indoors this lunchtime writing a typically verbose blog item I’d just pick something out of my back catalogue and give it another airing because it deals with something that’s come up a couple of times recently.
This is the time of year when final-year students are drafting their project reports. Yesterday I was back in Cardiff giving feedback on two such articles. I usually quite enjoy reading these things, in fact. They’re not too long and I’m usually pretty impressed with how the students have set about the (sometimes quite tricky) things I’ve asked them to do for their project work. I think the project report is quite a challenge for UK physics students because they generally haven’t had much practice in putting together a lengthy piece of writing before or during their university course, so haven’t developed a style that they feel comfortable with and are often unfamiliar with various conventions (such as reference style, punctuation of equations, etc). Some of these are explained in quite a lot of detail in the instructions the students are given, of course, but we all know that only girls read instructions….
The thing that strikes me most forcibly about the strange way students write project reports is that they are nearly always phrased entirely in the passive voice, e.g.
The experiment was calibrated using a phlogiston normalisation widget….
I accept that people disagree about whether the passive voice is good style or not. Some journals actively encourage the passive voice while others go the opposite way entirely . I’m not completely opposed to it, in fact, but I think it’s only useful either when the recipient of the action described in the sentence is more important than the agent, or when the agent is unknown or irrelevant. There’s nothing wrong with “My car has been stolen” (passive voice) since you would not be expected to know who stole it. On the other hand “My Hamster has been eaten by Freddy Starr” would not make a very good headline.
The point is that the construction of a statement in the passive voice in English is essentially periphrastic, in that it almost inevitably involves some form of circumlocution – either using more words than necessary to express the meaning or being deliberately evasive by introducing ambiguity. Both of these failings should be avoided in scientific writing.
Apparently, laboratory instructors generally tell students to write their reports in the passive voice as a matter of course. I think this is just wrong. In a laboratory report the student should describe what he or she did. Saying what “was done” often leaves the statement open to the interpretation that somebody else did it. The whole point of a laboratory report is surely for the students to describe their own actions. “We calibrated the experiment..” or “I calibrated the experiment…” are definitely to be preferred to the form I gave above.
That brings me to the choice of pronoun in the active voice. One danger is that it can appear very bombastic, but that’s not necessarily the case. I don’t find anything particularly wrong in saying, e.g.
We improve upon the technique of Jones et al. (1848) by introducing a variable doofer in the MacGuffin control, thereby removing gremlins from the thingummy process.
But the main issue is whether to use the singular or plural form. It can be irritating to keep encountering “I did this..” and “I did that..” all the way through a journal paper, and I certainly would feel uncomfortable writing a piece like that in the first person singular. I think it feels less egotistical to use “we”, even if there is only one author (which is increasingly rare in any case). If it’s good enough for the Queen it’s good enough for me! However, I just looked “we” up in Chambers dictionary and found
..used when speaking patronizingly, esp to children, to mean `you’.
which wasn’t at all what I had in mind!
However in the case of a student project that I’m assessing I actually want to know what the particular student writing the report did, not what was done by person or persons unspecified or by a group of uncertain composition. So I encourage my students to put, e.g.,
I wrote a computer program in 6502 Assembly Language to solve the Humdinger equation using the Dingbat-Schnitzelgruber algorithm.
I also (sometimes) like “we” when there’s, e.g., a complicated mathematical derivation. Going line by line through a lengthy piece or difficult technical argument seems friendlier if you imagine that the reader is trying to do the calculation along with you as you write it:
if we differentiate the right hand side of equation (8), use the expression for x obtained in equation (97), expand y in a power-series and take away the number we first thought of we find…
The “we” isn’t necessarily an author with delusions of grandeur (or schizophrenia), but instead denotes a joint operation between author and reader.
Anyway, to resume the thread, it seems to me that sometimes it is appropriate to use the passive voice because it is the correct grammatical construction in the circumstances. Sometimes also the text just seems to work better that way too. But having to read an entire document written in the passive voice drives me to distraction. It’s clumsy and dull.
In scientific papers, things are a little bit different but I still think using the active voice makes them easier to read and less likely to be ambiguous. In the introduction to a journal paper it’s quite acceptable to discuss the background to your work in the passive voice, e.g. “it is now generally accepted that…” but when describing what you and your co-authors have done it’s much better to use the active voice. “We observed ABC1234 using the Unfeasibly Large Telescope..” is, to my mind, much better than “Observations of ABC1234 were made using..”.
Reading back over this post I notice that I have jumped fairly freely between active and passive voice, thus demonstrating that I don’t have a dogmatic objection to its use. What I’m arguing is that it shouldn’t be the default, that’s all.
My guess is that a majority of experimental scientists won’t agree with this opinion, but a majority of astronomers and theoreticians will.
This guess will now be tested by reactivating an old poll..
This morning I was just thinking that it’s been a while since I’ve filed anything in the category marked bad statistics when I glanced at today’s copy of the Times Higherand found something that’s given me an excuse to rectify my lapse. Last week saw the publication of said organ’s new Student Experience Survey which ranks British Universities in order of the responses given by students to questions about various aspects of the teaching, social life and so on. I had a go at this table a few years ago, but they still keep trotting it out. Here are the main results, sorted in decreasing order:
University
Score
Resp.
1
University of East Anglia
84.8
119
2
University of Oxford
84.2
259
3
University of Sheffield
83.9
192
3
University of Cambridge
83.9
245
5
Loughborough University
82.8
102
6
University of Bath
82.7
159
7
University of Leeds
82.5
219
8
University of Dundee
82.4
103
9
York St John University
81.2
88
10
Lancaster University
81.1
100
11
University of Southampton
80.9
191
11
University of Birmingham
80.9
198
11
University of Nottingham
80.9
270
14
Cardiff University
80.8
113
14
Newcastle University
80.8
125
16
Durham University
80.3
188
17
University of Warwick
80.2
205
18
University of St Andrews
79.8
109
18
University of Glasgow
79.8
131
20
Queen’s University Belfast
79.2
101
21
University of Hull
79.1
106
22
University of Winchester
79
106
23
Northumbria University
78.9
100
23
University of Lincoln
78.9
103
23
University of Strathclyde
78.9
107
26
University of Surrey
78.8
102
26
University of Leicester
78.8
105
26
University of Exeter
78.8
130
29
University of Chester
78.7
102
30
Heriot-Watt University
78.6
101
31
Keele University
78.5
102
32
University of Kent
78.4
110
33
University of Reading
78.1
101
33
Bangor University
78.1
101
35
University of Huddersfield
78
104
36
University of Central Lancashire
77.9
121
37
Queen Mary, University of London
77.8
103
37
University of York
77.8
106
39
University of Edinburgh
77.7
170
40
University of Manchester
77.4
252
41
Imperial College London
77.3
148
42
Swansea University
77.1
103
43
Sheffield Hallam University
77
102
43
Teesside University
77
103
45
Brunel University
76.6
110
46
University of Portsmouth
76.4
107
47
University of Gloucestershire
76.3
53
47
Robert Gordon University
76.3
103
47
Aberystwyth University
76.3
104
50
University of Essex
76
103
50
University of Glamorgan
76
108
50
Plymouth University
76
112
53
University of Sunderland
75.9
100
54
Canterbury Christ Church University
75.8
102
55
De Montfort University
75.7
103
56
University of Bradford
75.5
52
56
University of Sussex
75.5
102
58
Nottingham Trent University
75.4
103
59
University of Roehampton
75.1
102
60
University of Ulster
75
101
60
Staffordshire University
75
102
62
Royal Veterinary College
74.8
50
62
Liverpool John Moores University
74.8
102
64
University of Bristol
74.7
137
65
University of Worcester
74.4
101
66
University of Derby
74.2
101
67
University College London
74.1
102
68
University of Aberdeen
73.9
105
69
University of the West of England
73.8
101
69
Coventry University
73.8
102
71
University of Hertfordshire
73.7
105
72
London School of Economics
73.5
51
73
Royal Holloway, University of London
73.4
104
74
University of Stirling
73.3
54
75
King’s College London
73.2
105
76
Bournemouth University
73.1
103
77
Southampton Solent University
72.7
102
78
Goldsmiths, University of London
72.5
52
78
Leeds Metropolitan University
72.5
106
80
Manchester Metropolitan University
72.2
104
81
University of Liverpool
72
104
82
Birmingham City University
71.8
101
83
Anglia Ruskin University
71.7
102
84
Glasgow Caledonian University
71.1
100
84
Kingston University
71.1
102
86
Aston University
71
52
86
University of Brighton
71
106
88
University of Wolverhampton
70.9
103
89
Oxford Brookes University
70.5
106
90
University of Salford
70.2
102
91
University of Cumbria
69.2
51
92
Napier University
68.8
101
93
University of Greenwich
68.5
102
94
University of Westminster
68.1
101
95
University of Bedfordshire
67.9
100
96
University of the Arts London
66
54
97
City University London
65.4
102
97
London Metropolitan University
65.4
103
97
The University of the West of Scotland
65.4
103
100
Middlesex University
65.1
104
101
University of East London
61.7
51
102
London South Bank University
61.2
50
Average scores
75.5
11459
YouthSight is the source of the data that have been used to compile the table of results for the Times Higher Education Student Experience Survey, and it retains the ownership of those data. Each higher education institution’s score has been indexed to give a percentage of the maximum score attainable. For each of the 21 attributes, students were given a seven-point scale and asked how strongly they agreed or disagreed with a number of statements based on their university experience.
My current employer, the University of Sussex, comes out right on the average (75.5) and is consequently in the middle in this league table. However, let’s look at this in a bit more detail. The number of students whose responses produced the score of 75.5 was just 102. That’s by no means the smallest sample in the survey, either. The University of Sussex has over 13,000 students. The score in this table is therefore obtained from less than 1% of the relevant student population. How representative can the results be, given that the sample is so incredibly small?
What is conspicuous by its absence from this table is any measure of the “margin-of-error” of the estimated score. What I mean by this is how much the sample score would change for Sussex if a different set of 102 students were involved. Unless every Sussex student scores exactly 75.5 then the score will vary from sample to sample. The smaller the sample, the larger the resulting uncertainty.
Given a survey of this type it should be quite straightforward to calculate the spread of scores from student to student within a sample from a given University in terms of the standard deviation, σ, as well as the mean score. Unfortunately, this survey does not include this information. However, lets suppose for the sake of argument that the standard deviation for Cardiff is quite small, say 10% of the mean value, i.e. 7.55. I imagine that it’s much larger than that, in fact, but this is just meant to be by way of an illustration.
If you have a sample size of N then the standard error of the mean is going to be roughly (σ⁄√N) which, for Sussex, is about 0.75. Assuming everything has a normal distribution, this would mean that the “true” score for the full population of Sussex students has a 95% chance of being within two standard errors of the mean, i.e. between 74 and 77. This means Sussex could really be as high as 43rd place or as low as 67th, and that’s making very conservative assumptions about how much one student differs from another within each institution.
That example is just for illustration, and the figures may well be wrong, but my main gripe is that I don’t understand how these guys can get away with publishing results like this without listing the margin of error at all. Perhaps its because that would make it obvious how unreliable the rankings are? Whatever the reason we’d never get away with publishing results without errors in a serious scientific journal.
This sampling uncertainty almost certainly accounts for the big changes from year to year in these tables. For instance, the University of Lincoln is 23rd in this year’s table, but last year was way down in 66th place. Has something dramatic happened there to account for this meteoric rise? I doubt it. It’s more likely to be just a sampling fluctuation.
In fact I seriously doubt whether any of the scores in this table is significantly different from the mean score; the range from top to bottom is only 61 to 85 showing a considerable uniformity across all 102 institutions listed. What a statistically literate person should take from this table is that (a) it’s a complete waste of time and (b) wherever you go to University you’ll probably have a good experience!
I’m on campus to get some work done but before that I thought I do a quick postette as I eat my lunch. A good topic for a short contribution is a story I heard last week from one of my colleagues in the Department of Physics & Astronomy here at the University of Sussex. It seems he gave a talk at a conference a while ago. As is far from unusual in such circumstances he was asked to write up his contribution for a special edition of a journal.
Before I go on I’ll just digress a bit to mention a less well-known aspect of the Academic Publishing Racket, the Conference Proceedings Volume. For a long time you couldn’t attend a conference in astrophysics without having to contribute an article to one of these books. Although usually produced on the cheap, using camera-ready copy, and with minimal editorial oversight, these were sold to participants and (more lucratively) to university libraries at enormously inflated prices, often over £100 a go. It wasn’t unusual for funding agencies to insist that a conference talk be followed up with a publication, so this racket flourished for a while. I’ve actually got a shelf full of such volumes accumulated over the years, although I don’t really know why I kept them as it is in their nature that they date very quickly.
Anyway, as time passed, and the internet expanded and improved, most conference organizers began to realize that it was much better just to keep their own record of the conference: putting summaries, and even full presentations, on the web for interested persons to download gratis. No doubt it is still de rigueur in some subjects to produce books of this type, but most in astrophysics don’t bother any more. Quite rightly, in my opinion. I think they’re a waste of time, money and shelf space.
The original thread of this post, however, isn’t about standalone books of conference proceedings but special editions of a regular academic journal; for an example of one such see here. Note the unsubtle and entirely gratuitous link to one of my own papers! I’ve always thought this format was just as bad as putting them in a book, with the additional disadvantage that people might misinterpret the journal reference as meaning that the paper had been refereed. The paper I linked to above was not refereed, for instance. In any case they’re a bit of a chore to write, and are just as likely to be of ephemeral interest, but if one is invited to give a talk one generally feels obliged to play ball and deliver the article requested.
Which all brings me back to my colleague here at Sussex. He did his talk and wrote up the obligatory article for the special journal edition of the conference proceedings. But times have changed. When he tried to submit his article via the web upload facility he was directed to a screen asking whether his work was funded by the Science and Technology Facilities Council. When he answered “yes” he was told he was obliged to pay $3000 for the privilege of publishing his paper in Gold Open Access mode….
When he asked me if the School of Mathematical and Physical Sciences would pay the $3000 I nearly had a seizure. It’s bad enough getting landed with a hefty bill for writing an article as a favour to the conference organizers, but it’s even worse than that. The publisher was deliberately and disgracefully misleading the author about the RCUK policy on open access in order to take money from them. There is no requirement for researchers to pay for Gold OA in such a case. Sharp practice is too polite a phrase to describe the actions of this publisher. And of course nobody mentioned the $3000 fee when he signed up to give a talk at the conference.
Unfortunately, I think this sort of questionable business practice is bound to proliferate as publishers seek to maximize their revenue from Gold Open Access before the academic community rumbles the scam and cuts them out all together. So let this post be a warning. Do not trust academic publishers who try to charge you up front. Check the rules very carefully before committing yourself or, preferably, declining to publish with them. There are sharks out there and they’re after your funding.
Oh, and the name of the publisher involved in the scam I just described? I’m sure you can guess it before clicking this link to check.
The views presented here are personal and not necessarily those of my employer (or anyone else for that matter).
Feel free to comment on any of the posts on this blog but comments may be moderated; anonymous comments and any considered by me to be vexatious and/or abusive and/or defamatory will not be accepted. I do not necessarily endorse, support, sanction, encourage, verify or agree with the opinions or statements of any information or other content in the comments on this site and do not in any way guarantee their accuracy or reliability.