Archive for Cosmology

A little knowledge….

Posted in Uncategorized with tags , , , on March 2, 2011 by telescoper

A little knowledge is a dangerous thing, but for a homeopath no knowledge at all will apparently do just as well.

No satire  is necessary (or indeed possible) for the following clip, although you could try making a list of the basic conceptual errors until you feel obliged to switch off your computer in order to stop yourself from throwing it out of the window, and even if that only takes a few seconds you’ll still need a  lot of paper…


Share/Bookmark

Which side (of the Einstein equations) are you on?

Posted in The Universe and Stuff with tags , , , , , , on February 22, 2011 by telescoper

As a cosmologist, I am often asked why it is that people talk about the cosmological constant as if it were some sort of vacuum energy or “dark energy“. I was explaining it again to a student today so I thought I’d jot something down here so I can use it for future reference. In a nutshell, it goes like this. The original form of Einstein’s equations for general relativity can be written

R_{ij}-\frac{1}{2}g_{ij}R = \frac{8\pi G}{c^4} T_{ij}.

The precise meaning of the terms on the left hand side doesn’t really matter, but basically they describe the curvature of space-time and are derived from the Ricci tensor R_{ij} and the metric tensor g_{ij}; this is how Einstein’s theory expresses the effect of gravity warping space. On the right hand side we have the energy-momentum tensor (sometimes called the stress tensor) T_{ij}, which describes the distribution of matter and its motion. Einstein’s equations can be summarised in John Archibald Wheeler’s pithy phrase: “Space tells matter how to move; matter tells space how to curve”.

In standard cosmology we usually assume that we can describe the matter-energy content of the Universe as a uniform perfect fluid, for which the energy-momentum tensor takes the simple form

T_{ij} = -pg_{ij} +\left(p+\rho c^2\right) U_i U_j,

in which p is the pressure and \rho the density; U_i is the fluid’s 4-velocity.

Einstein famously modified (or perhaps generalised) the original equations by adding a cosmological constant term \Lambda to the left hand side thus:

R_{ij}-\frac{1}{2}g_{ij}R -\Lambda g_{ij} = \frac{8\pi G}{c^4} T_{ij}.

Doing this essentially modifies the description of gravity, or appears to do so because it happens to be written on the left hand side of the equation. In fact one could equally well move the term involving \Lambda to the other side and absorb it into a redefined energy-momentum tensor, \tilde{T}_{ij}:

R_{ij}-\frac{1}{2}g_{ij}R = \frac{8\pi G}{c^4} \tilde{T}_{ij}.

The new energy-momentum tensor needed to make this work is of the form

\tilde{T}_{ij}=T_{ij}+ \left(\frac{\Lambda c^{4}}{8 \pi G} \right) g_{ij}= -\tilde{p} g_{ij} +\left(\tilde{p}+\tilde{\rho} c^2\right) U_i U_j

where

\tilde{p}=p-\frac{\Lambda c^4}{8\pi G}

\tilde{\rho}=\rho + \frac{\Lambda c^4}{8\pi G}

So the cosmological constant now looks like you didn’t modify gravity at all, but created an additional contribution to the pressure and density of the original fluid. In fact, considering the correction terms on their own it is clear that the cosmological constant acts exactly like an additional perfect fluid contribution with p=-\rho c^2.

This is just one simple example wherein a modification of the gravitational part of the theory can be made to look like the appearance of a peculiar form of matter. More complicated versions of this idea – most of them entirely speculative – abound in theoretical cosmology. That’s just what cosmologists are like.

Over the last few decades cosmology has suffered an invasion by been stimulated and enriched by particle physicists who would like to understand how such a mysterious form of energy might arise in their theories. That at least partly explains why, in one sense at least,  modern cosmologists prefer to dress to the right.

Incidentally, another interesting point is why people say such a fluid describes a cosmological “vacuum” energy. In the cosmological setting, i.e. assuming the fluid is distributed in  a homogeneous and isotropic fashion then the energy density of the expanding Universe varies with (cosmological proper) time according to

\dot{\rho}=-3\left(\frac{\dot{a}}{a}\right) \left(\rho + \frac{p}{c^2}\right)

so for our strange fluid, the second term in brackets vanishes and we have \dot{\rho}=0
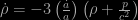
. As the universe expands, normal forms of matter and radiation get diluted, but the energy density of this stuff remains constant. It seems to me to be quite appropriate for a vacuum to something which, no matter how hard you try,  you can’t dilute!

I hope this clarifies the situation.


Share/Bookmark

Bayes’ Razor

Posted in Bad Statistics, The Universe and Stuff with tags , , , , , , , , , on February 19, 2011 by telescoper

It’s been quite while since I posted a little piece about Bayesian probability. That one and the others that followed it (here and here) proved to be surprisingly popular so I’ve been planning to add a few more posts whenever I could find the time. Today I find myself in the office after spending the morning helping out with a very busy UCAS visit day, and it’s raining, so I thought I’d take the opportunity to write something before going home. I think I’ll do a short introduction to a topic I want to do a more technical treatment of in due course.

A particularly important feature of Bayesian reasoning is that it gives precise motivation to things that we are generally taught as rules of thumb. The most important of these is Ockham’s Razor. This famous principle of intellectual economy is variously presented in Latin as Pluralites non est ponenda sine necessitate or Entia non sunt multiplicanda praetor necessitatem. Either way, it means basically the same thing: the simplest theory which fits the data should be preferred.

William of Ockham, to whom this dictum is attributed, was an English Scholastic philosopher (probably) born at Ockham in Surrey in 1280. He joined the Franciscan order around 1300 and ended up studying theology in Oxford. He seems to have been an outspoken character, and was in fact summoned to Avignon in 1323 to account for his alleged heresies in front of the Pope, and was subsequently confined to a monastery from 1324 to 1328. He died in 1349.

In the framework of Bayesian inductive inference, it is possible to give precise reasons for adopting Ockham’s razor. To take a simple example, suppose we want to fit a curve to some data. In the presence of noise (or experimental error) which is inevitable, there is bound to be some sort of trade-off between goodness-of-fit and simplicity. If there is a lot of noise then a simple model is better: there is no point in trying to reproduce every bump and wiggle in the data with a new parameter or physical law because such features are likely to be features of the noise rather than the signal. On the other hand if there is very little noise, every feature in the data is real and your theory fails if it can’t explain it.

To go a bit further it is helpful to consider what happens when we generalize one theory by adding to it some extra parameters. Suppose we begin with a very simple theory, just involving one parameter p, but we fear it may not fit the data. We therefore add a couple more parameters, say q and r. These might be the coefficients of a polynomial fit, for example: the first model might be straight line (with fixed intercept), the second a cubic. We don’t know the appropriate numerical values for the parameters at the outset, so we must infer them by comparison with the available data.

Quantities such as p, q and r are usually called “floating” parameters; there are as many as a dozen of these in the standard Big Bang model, for example.

Obviously, having three degrees of freedom with which to describe the data should enable one to get a closer fit than is possible with just one. The greater flexibility within the general theory can be exploited to match the measurements more closely than the original. In other words, such a model can improve the likelihood, i.e. the probability  of the obtained data  arising (given the noise statistics – presumed known) if the signal is described by whatever model we have in mind.

But Bayes’ theorem tells us that there is a price to be paid for this flexibility, in that each new parameter has to have a prior probability assigned to it. This probability will generally be smeared out over a range of values where the experimental results (contained in the likelihood) subsequently show that the parameters don’t lie. Even if the extra parameters allow a better fit to the data, this dilution of the prior probability may result in the posterior probability being lower for the generalized theory than the simple one. The more parameters are involved, the bigger the space of prior possibilities for their values, and the harder it is for the improved likelihood to win out. Arbitrarily complicated theories are simply improbable. The best theory is the most probable one, i.e. the one for which the product of likelihood and prior is largest.

To give a more quantitative illustration of this consider a given model M which has a set of N floating parameters represented as a vector \underline\lambda = (\lambda_1,\ldots \lambda_N)=\lambda_i; in a sense each choice of parameters represents a different model or, more precisely, a member of the family of models labelled M.

Now assume we have some data D and can consequently form a likelihood function P(D|\underline{\lambda},M). In Bayesian reasoning we have to assign a prior probability P(\underline{\lambda}|M) to the parameters of the model which, if we’re being honest, we should do in advance of making any measurements!

The interesting thing to look at now is not the best-fitting choice of model parameters \underline{\lambda} but the extent to which the data support the model in general.  This is encoded in a sort of average of likelihood over the prior probability space:

P(D|M) = \int P(D|\underline{\lambda},M) P(\underline{\lambda}|M) d^{N}\underline{\lambda}.

This is just the normalizing constant K usually found in statements of Bayes’ theorem which, in this context, takes the form

P(\underline{\lambda}|DM) = K^{-1}P(\underline{\lambda}|M)P(D|\underline{\lambda},M).

In statistical mechanics things like K are usually called partition functions, but in this setting K is called the evidence, and it is used to form the so-called Bayes Factor, used in a technique known as Bayesian model selection of which more anon….

The  usefulness of the Bayesian evidence emerges when we ask the question whether our N  parameters are sufficient to get a reasonable fit to the data. Should we add another one to improve things a bit further? And why not another one after that? When should we stop?

The answer is that although adding an extra degree of freedom can increase the first term in the integral defining K (the likelihood), it also imposes a penalty in the second factor, the prior, because the more parameters the more smeared out the prior probability must be. If the improvement in fit is marginal and/or the data are noisy, then the second factor wins and the evidence for a model with N+1 parameters lower than that for the N-parameter version. Ockham’s razor has done its job.

This is a satisfying result that is in nice accord with common sense. But I think it goes much further than that. Many modern-day physicists are obsessed with the idea of a “Theory of Everything” (or TOE). Such a theory would entail the unification of all physical theories – all laws of Nature, if you like – into a single principle. An equally accurate description would then be available, in a single formula, of phenomena that are currently described by distinct theories with separate sets of parameters. Instead of textbooks on mechanics, quantum theory, gravity, electromagnetism, and so on, physics students would need just one book.

The physicist Stephen Hawking has described the quest for a TOE as like trying to read the Mind of God. I think that is silly. If a TOE is every constructed it will be the most economical available description of the Universe. Not the Mind of God.  Just the best way we have of saving paper.


Share/Bookmark

The Bull’s-Eye Effect

Posted in The Universe and Stuff with tags , , , , on February 10, 2011 by telescoper

What a day.

For a start we had another manic UCAS admissions event. Applications to study physics here have rocketed, by more than 50% compared to last year, so it’s all hands on deck on days like this. Next weekend we have our first Saturday event of the year, and that promises to be even more popular. Still, it’s good to be busy. Without the students, we’d all be on Her Majesty’s Dole. At least some of our advertising is hitting the target.

After that it was back to the business of handing out 1st Semester examination results to my tutees – the Exam Board met yesterday but I skived off because I wasn’t involved in any exams last semester. Then a couple of undergraduate project meetings and a few matters related to postgraduate admissions that needed sorting out.

Finally, being a member of our esteemed Course Committee, I spent a little bit of time trying to assemble some new syllabuses. All our Physics (and Astrophysics) courses are changing next year, so this is a good chance to update the content and generally freshen up some of the material we teach.

In the course of thinking about this, I dug about among some of my old course notes from here there and everywhere, some of which I’ve kept on an old laptop. I chanced upon this cute little graphic, which I don’t think I’ve ever used in a lecture, but I thought I’d put it up here because it’s pretty. Sort of.

What it shows is a simulation of the large-scale structure of the Universe as might be mapped out using a galaxy redshift survey. The observer is in the centre of the picture (which a two-dimensional section through the Universe); the position of each galaxy is plotted by assuming that the apparent recession velocity (which is what a redshift survey measures) is related to the distance from the observer by Hubble’s Law:

V\simeq cz =H_0 R

where V  is the recession velocity, z  is the redshift, H_0 is Hubble’s constant  and R is the radial distance of the galaxy. However, this only applies exactly in a completely homogeneous Universe. In reality the various inhomogeneities (galaxies, clusters and superclusters) introduce distortions into the Hubble Law by generating peculiar velocities

V=H_0 R+ V_p

These distort the pattern seen in redshift space compared to real space. In real space the pattern is statistically isotropic, but in redshift space things look different along the line of sight from the observer compared to the directions at right angles as described quite nicely by this slide from a nice web page on redshift-space distortions.

There are two effects. One is that galaxies in tightly bound clusters have high-speed disordered motions. This means that each cluster is smeared out along the line of sight in redshift space, producing artefacts sometimes called “Fingers of God” – elongated structures that always point ominously at the observer. The other effect caused by large-scale coherent motions as matter flows into structures that are just forming, which squashes large-scale features in the redshift direction more-or-less opposite to the first.

These distortions don’t simply screw up our attempts to map the Universe. In fact they help us figure out how much matter might pulling the galaxies about. The number in the upper left of the first (animated) figure is the density parameter, \Omega. The higher this number is, the more matter there is to generate peculiar motions so the more pronounced the alteration; in a low density universe, real and redshift space look rather similar.

Notice that in the high-density universe the wall-like structures look thicker (owing to the large peculiar velocities within them) but that they are also larger than in the low-density universe. In a paper a while ago, together with Adrian Melott and others, we investigated  the dynamical origin of this phenomenon, which we called the Bull’s-Eye Effect because it forms prominent rings around the central point. It turns out to be Quite Interesting, because the merging of structures in redshift-space to create larger ones is entirely analogous the growth of structure by hierarchical merging in real space, and can be described by the same techniques. In effect, looking in redshift space gives you a sneak preview of how the stucture will subsequently evolve in real space…


Share/Bookmark

Certain Scientists aren’t Good Scientists

Posted in Science Politics, The Universe and Stuff with tags , , , , , on January 30, 2011 by telescoper

Just time for a quickie today because tomorrow is the first day of teaching (in what we optimistically call the “Spring Semester”) and I’ve decided to head into the department this afternoon to prepare some handouts and concoct some appropriately fiendish examples for my first problem set.

I thought I’d take the opportunity to add a little postscript to some comments I made in a post earlier this week on the subject of misguided criticisms of science. Where I (sometimes) tend to agree with some such attacks is when they are aimed at scientists who have exaggerated levels of confidence in the certainty of their results. The point is that scientific results are always conditional, which is to say that they are of the form “IF we assume this theoretical framework and have accounted for all sources of error THEN we can say this”.

To give an example from my own field of cosmology we could say “IF we assume the general theory of relativity applies and the Universe is homogeneous and isotropic on large scales and we have dealt with all the instrumental uncertainties involved etc etc THEN 74% of the energy density in the Universe is in a form we don’t understand (i.e. dark energy).” We don’t know for sure that dark energy exists, although it’s a pretty solid inference, because it’s by no means certain that our assumptions – and there are a lot of them – are all correct.

Similar statements are made in the literature across the entire spectrum of science. We don’t deal with absolute truths, but always work within a given theoretical framework which we should always be aware might be wrong. Uncertainty also derives from measurement error and statistical noise. A scientist’s job is to deal with all these ifs buts and don’t-knows in as hard-nosed a way as possible.

The big problem is that, for a variety of reasons, many people out there don’t understand that this is the way science works. They think of science in terms of a collection of yes or no answers to well-posed questions, not the difficult and gradual process of gathering understanding from partial clues and (occasionally inspired) guesswork.

Why is this? There are several reasons. One is that our system of science education does not place sufficient emphasis on science-as-method as opposed to science-as-facts. Another is that the media don’t have time for scientists to explain the uncertainties. With only a two-minute slot on the news to explain cosmology to a viewer waiting for the football results all you can do is deliver a soundbite.
This is what I wrote in my book From Cosmos to Chaos:

Very few journalists or television producers know enough about science to report sensibly on the latest discoveries or controversies. As a result, important matters that the public needs to know about do not appear at all in the media, or if they do it is in such a garbled fashion that they do more harm than good. I have listened many times to radio interviews with scientists on the Today programme on BBC Radio 4. I even did such an interview once. It is a deeply frustrating experience. The scientist usually starts by explaining what the discovery is about in the way a scientist should, with careful statements of what is assumed, how the data is interpreted, and what other possible interpretations might be. The interviewer then loses patience and asks for a yes or no answer. The scientist tries to continue, but is badgered. Either the interview ends as a row, or the scientist ends up stating a grossly oversimplified version of the story.

Here’s another, more recent, example. A couple of weeks ago, a clutch of early release papers from the Planck satellite came out; I blogged about them here. Among these results were some interesting new insights concerning the nature of the Anomalous Microwave Emission (AME) from the Milky Way; the subject of an excellent presentation by Clive Dickinson at the conference where the results were announced.

The title of a story in National Geographic is typical of the coverage this result received:

Fastest Spinning Dust Found; Solves Cosmic “Fog” Puzzle

Now look at the actual result. The little bump in the middle is the contribution from the anomalous emission, and the curve underneath it shows the corresponding “spinning dust” model:

There’s certainly evidence that supports this interpretation, but it’s clearly nowhere near the level of “proof”. In fact, in Clive’s talk he stated the result as follows:

Plausible physical models appear to fit the data

OK, so that would never do for a headline in a popular magazine, but I hope I’ve made my point. There’s a big difference between what this particular scientist said and what was presented through the media.

I hope you’re not thinking that I’m criticising this bit of work. Having read the papers I think it’s excellent science.

But it’s not just the fault of the educationalists and the media. Certain scientists play this dangerous game themselves. Some enjoy their 15 minutes – or, more likely, two minutes – of fame so much that they will happily give the journalists what they want regardless of the consequences. Worse still, even in the refereed scientific literature you can find examples of scientists clearly overstating the confidence that should be placed in their results. We’re all human, of course, but my point is that a proper statement of the caveats is at least as much a part of good science as theoretical calculation, clever instrument design or accurate observation and experiment.

We can complain all we like about non-scientists making ill-informed criticisms of science, but we need to do a much better job at being honest about what little we really know and resist the temptation to be too certain.


Share/Bookmark

Hard Decisions, Easy Targets

Posted in Science Politics, The Universe and Stuff with tags , , , , , , on January 25, 2011 by telescoper

Just back from a day trip to London – at the Institute of Physics to be precise – to wrap up the proceedings of this years protracted STFC Astronomy Grants Panel (AGP) business. The grant letters have already gone out, so no real decisions were made relating to the current round, but we did get the chance to look at a fairly detailed breakdown of the winners and losers. Perhaps more significantly we also discussed issues relating to the implementation of the brand new system which will be in place for 2011/12.

I’m not exactly sure at the moment how much of what we discussed is in the public domain, so I won’t write anything about the meeting here. Tomorrow there is a meeting of the RAS Astronomy Forum at which department representatives will also be briefed about these issues. I will, however, in due course, on as much information as I can through this blog in case there is anyone out there who doesn’t hear it via the Forum.

Not being able to blog about AGP business, I thought I’d comment briefly on a couple of recent things that sprang to mind on the train journey into London. Last night there was a programme in the BBC series Horizon called Science under Attack, presented by Nobel laureate Sir Paul Nurse. I didn’t watch all of it, but I was fortunate (?) enough to catch a segment featuring a chap called James Delingpole, whom I’d never heard of before, but who apparently writes for the Daily Torygraph.

My immediate reaction to his appearance on the small screen was to take an instant dislike to him. This is apparently not an uncommon response, judging by the review of the programme in today’s Guardian. I wouldn’t have bothered blogging about this at all had I wanted to indulge in an ad hominem attack on this person, but he backed up his “unfortunate manner” by saying some amazing things, such as

It’s not my job to sit down and read peer-reviewed papers, because I don’t have the time; I don’t have the expertise

Yet he feels qualified to spout off on the subject nevertheless. The subject, by the way, was climate change. I’m sure not even the most hardened climate skeptic would want Mr Delingpole on their side judging by his performance last night or, apparently, his track-record.

Anyway, this episode reminded me of another egregious example of uninformed drivel that appeared in last week’s Times Higher. This was a piece purporting to be about the limits of mathematical reasoning by another person who is quite new to me, Chris Ormell, who appears to have some academic credentials, if only in the field of philosophy.

Ormell’s piece includes a rant about cosmology which is on a par with Delingpole’s scribblings about climate change, in that he has absolutely no idea what he is talking about. Jon Butterworth and Sean Carroll have already had a go at pointing out the basic misunderstandings, so I won’t repeat the hatchet job here. If I had blogged about this at the weekend – which I might have done had my rodent visitor not intervened – I would have been considerably less polite than either of them. Ormell clearly hasn’t even read a wikipedia article on cosmology, never mind studied it to a level sufficiently deep to justify him commenting on it in a serious magazine.

I’m still amazed that such a pisspoor article could have made it through the Times Higher’s editorial procedures but more worrying still is the ract that Ormell is himself the editor of a journal, called Prospero, which is “a journal of new thinking of philosophy for education”. The last thing education needs is a journal edited by someone so sloppy that he can’t even be bothered to acquire a basic understanding of his subject matter.

What’s in common between these stories is, however, in my opinion, much more important than the inadequate scientific understanding of the personalities involved. Rubbishing the obviously idiotic, which is quite easy to do, may blind us to the fact that, behind all the errors, however badly expressed it may be, people like this may just have a point. Too often the scientific consensus is portrayed as fact when there are clearly big gaps missing in our understanding. Of course falsehoods should be corrected, but what science really needs to go forward is for bona fide scientists to be prepared to look at the technical arguments openly and responsibly and be candid about the unknowns and uncertainties. Big-name scientists should themselves be questioning the established paradigms and be actively exploring alternative hypotheses. That’s their job. Closing ranks and stamping on outsiders is what makes the public suspicious, not reasoned argument.

In both climatology and cosmology there are consensus views. Based on what knowledge I have, which is less in the former case than in the latter, both these views are reasonable inferences but not absolute truths. In neither case am I a denier, but in both cases I am a skeptic. Call me old-fashioned, but I think that’s what a scientist should be.


Share/Bookmark

What is a Galaxy?

Posted in The Universe and Stuff with tags , , , , , , on January 19, 2011 by telescoper

An interesting little paper by Duncan Forbes and  Pavel Kroupa appeared today on the arXiv today. It asks what you would have thought was the rather basic question “What is a Galaxy?”. Like many basic questions, however, it turns out to be much  more complicated than you imagined.

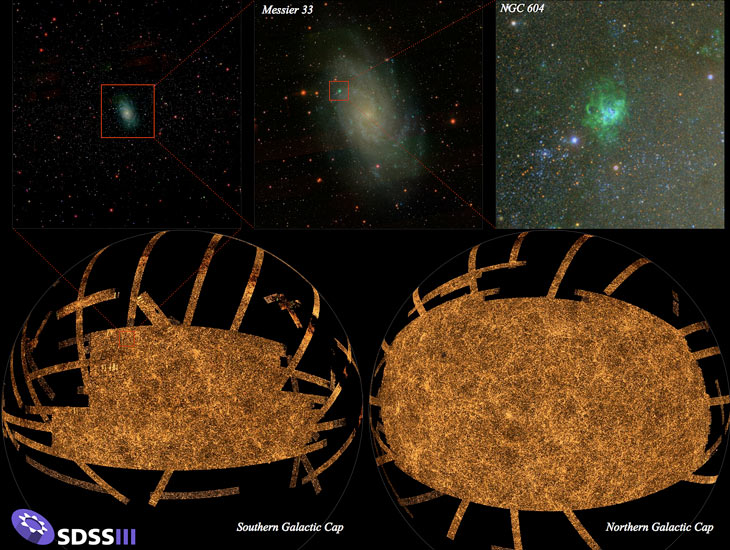
Ask most people what they think a galaxy is and they’ll think of something like Andromeda (or M31), shown on the left, with its lovely spiral arms. But galaxies exist in many different types, which have quite different morphologies, dynamical properties and stellar populations.

The paper by Forbes and Kroupa lists examples of definitions from technical articles and elsewhere. The Oxford English Dictionary, for instance, gives

Any of the numerous large groups of stars and other
matter that exist in space as independent systems.

I suppose that is OK, but isn’t very  precise. How do you define “independent”, for example? Two galaxies orbiting in a binary system aren’t independent, but you would still want to count them as two galaxies rather than one. A group or cluster of galaxies is likewise not a single large galaxy, at least not by any useful definition. At the other extreme, what about a cluster of stars or even a binary star system? Why aren’t they regarded as gaaxies too? They are (or can be) gravitationally bound..

Clearly we have a particular size in mind, but even if we restrict ourselves to “galaxy-sized” objects we still have problems. Why is a globular cluster not a small galaxy while a dwarf galaxy is?

To be perfectly honest, I don’t really care very much about nomenclature. A rose by any other name would smell as sweet, and a galaxy by any other name would be just as luminous. What really counts are the physical properties of the various astronomical systems we find because these are what have to be explained by astrophysicists.

Perhaps it would be better to adopt Judge Potter Stewart‘s approach. Asked to rule on an obscenity case, he wrote that hard-core pornography was difficult to define, but ” I know it when I see it”….

As a cosmologist I tend to think that there’s only one system that really counts – the Universe, and galaxies are just bits of the Universe where stars seemed to have formed and organised themselves into interesting shapes. Galaxies may be photogenic, nice showy things for impressing people, but they aren’t really in themselves all that important in the cosmic scheme of things. They’re just the Big Bang’s bits of bling.

I’m not saying that galaxies aren’t extremely useful for telling us about the Universe; they clearly are. They shed light (literally) on a great many things that we wouldn’t otherwise have any clue about. Without them we couldn’t even have begun to do cosmology, and they still provide some of the most important evidence in the ongoing investigation of the the nature of the Universe. However, I think what goes on in between the shiny bits is actually much more interesting from the point of view of fundamental physics than the shiny things themselves.

Anyway, I’m rambling again and I can hear the observational astronomers swearing at me through their screens, so let me move on to the fun bit of the paper I was discussing, which is that the authors list a number of possible definitions of a galaxy and invite readers to vote.

For your information, the options (discussed in more detail in the paper) for the minimum criteria to define a galaxy are:

  • The relaxation time is greater than the age of the Universe
  • The half-light radius is greater than 10 parsecs
  • The presence of complex stellar systems
  • The presence of dark matter
  • Hosts a satellite stellar system

I won’t comment on the grammatical inconsistency of these statements. Or perhaps I just did. I’m not sure these would have been my choices either, but there you are. There’s an option to add your own criteria anyway.

The poll can be found here.

Get voting!

UPDATE: In view of the reaction some of my comments have generated from galactic astronomers I’ve decided to add a poll of my own, so that readers of this blog can express their opinions in a completely fair and unbiased way:


Share/Bookmark

Mud Wrestling and Microwaves

Posted in The Universe and Stuff with tags , , , on January 13, 2011 by telescoper

Reading through an interesting blog post about the new results from Planck by the ever-reliable Jonathan Amos (the BBC’s very own “spaceman”), I was reminded of a comment I heard made by Martin Rees (now Lord Rees) many years ago.

The remark concerned the difference between cosmology and astrophysics. Cosmology, said Lord Rees, especially the part of it that concerns the very early Universe, involves abstract mathematical concepts, difficult yet logical reasoning and the ability to see deep things in complicated spatial patterns. In that respect it’s rather like chess. Astrophysics, on the other hand, which is not at all elegant and has so many messy complications that it is sometimes difficult even to work out what is going on or what the rules are, is more like mud wrestling.

The following image, which I borrowed from Jonathan Amos’ piece, explains why I was reminded of this and why some cosmologists are having to abandon chess for mud wrestling, at least for the time being. The picture shows the nine individual frequency maps (spanning the range from 30 GHz to 857 GHz) obtained by Planck.

What we cosmologists really want to see is a pristine map of the cosmic microwave background, the black-body radiation that pervades the entire Universe. It’s black body form means that it would have the same brightness temperature across all frequencies, and would also be statistically homogeneous (i.e. looking roughly the same all across the sky).

What you actually see is a mess. There are strong contributions from the disk of our own Galaxy, some of it extending quite a way above and below the plane of the Milky Way. You can also see complicated residuals produced by the way Planck scans the sky. On top of that there is radiation from individual sources within our Galaxy, other Galaxies and even clusters of Galaxies (which I mentioned a couple of days ago). These “contaminants” constitute valuable raw material for astronomers of various sorts, but for cosmologists they are an unwanted nuisance. Unfortunately, there is no other way to reach the jewels of the CMB than by hacking through this daunting jungle of foregrounds and instrumental artefacts.

Looking at the picture might induce one of two reactions. One would be to assume that there’s no way that all the crud can be removed with sufficient accuracy and precision to do cosmology with what’s left. Another is  to appreciate how well cosmologists have done with previous datasets, especially WMAP, have confidence that they’ll solve the numerous problems associated with the Planck data, but understand why  will take another two years of high-powered data analysis by a very large number of very bright people to extract cosmological results from Planck.

There might be gold at the end of the pipeline, but until then it’s going to be mud, glorious mud…


Share/Bookmark

SDSS-III and the Cosmic Web

Posted in The Universe and Stuff with tags , , , , , on January 12, 2011 by telescoper

It’s typical, isn’t it? You wait weeks for an interesting astronomical result to blog about and then two come along together…

Another international conference I’m not at is the 217th Meeting of the American Astronomical Society in the fine city of Seattle, which yesterday saw the release of some wonderful things produced by SDSS-III, the third incarnation of the Sloan Digital Sky Survey. There’s a nice article about it in the Guardian, followed by the usual bizarre selection of comments from the public.

I particularly liked the following picture of the cosmic web of galaxies, clusters and filaments that pervades the Universe on scales of hundreds of millions of lightyears, although it looks to me like a poor quality imitation of a Jackson Pollock action painting:

The above image contains about 500 million galaxies, which represents an enormous advance in the quest to map the local structure of the Universe in as much detail as possible. It will also improve still further the precision with which cosmologists can analyse the statistical properties of the pattern of galaxy clustering.

The above represents only a part (about one third) of the overall survey; the following graphic shows how much of the sky has been mapped. It also represents only the imaging data, not the spectroscopic information and other information which is needed to analyse the galaxy distribution in full detail.

There’s also a short video zooming out from one galaxy to the whole Shebang.

The universe is a big place.


Share/Bookmark

First Science from Planck

Posted in The Universe and Stuff with tags , , , , , , , , , on January 11, 2011 by telescoper

It’s been quite a long wait for results to emerge from the Planck satellite, which was launched in May 2009, but today the first science results have at last been released. These aren’t to do with the cosmological aspects of the mission – those will have to wait another two years – but things we cosmologists tend to think of as “foregrounds”, although they are of great astrophysical interest in themselves.

For an overview, with lots of pretty pictures,  see the European Space Agency’s Planck site and the UK Planck outreach site; you can also watch this morning’s press briefing in full here.

A repository of all 25 science papers can be found here and there’ll no doubt be a deluge of them on the arXiv tomorrow.

A few of my Cardiff colleagues are currently in Paris living it up at the junket working hard at the serious scientific conference at which these results are being discussed. I, on the other hand, not being one of the in-crowd, am back here in Cardiff, only have a short window in between meetings, project vivas and postgraduate lectures  to comment on the new data. I’m also sure there’ll be a huge amount of interest in the professional media and in the blogosphere for some time to come. I’ll therefore just mention a couple of things that struck me immediately as I went quickly through the papers while I was eating my sandwich; the following was cobbled together from the associated ESA press release.

The first concerns the so-called  ‘anomalous microwave emission’ (aka Foreground X) , which is a diffuse glow most strongly associated with the dense, dusty regions of our Galaxy. Its origin has been a puzzle for decades, but data collected by Planck seem to confirm the theory that it comes from rapidly spinning dust grains. Identifying the source of this emission will help Planck scientists remove foreground contamination which much greater precision, enabling them to construct much cleaner maps of the cosmic microwave background and thus, among other things, perhaps clarify the nature of the various apparent anomalies present in current cosmological data sets.

Here’s a nice composite image of a region of anomalous emission, alongside individual maps derived from low-frequency radio observations as well as two of the Planck channels (left).

Credits: ESA/Planck Collaboration

The colour composite of the Rho Ophiuchus molecular cloud highlights the correlation between the anomalous microwave emission, most likely due to miniature spinning dust grains observed at 30 GHz (shown here in red), and the thermal dust emission, observed at 857 GHz (shown here in green). The complex structure of knots and filaments, visible in this cloud of gas and dust, represents striking evidence for the ongoing processes of star formation. The composite image (right) is based on three individual maps (left) taken at 0.4 GHz from Haslam et al. (1982) and at 30 GHz and 857 GHz by Planck, respectively. The size of the image is about 5 degrees on a side, which is about 10 times the apparent diameter of the full Moon.

The second of the many other exciting results presented today that I wanted to mention is a release of new data on clusters of galaxies – the largest structures in the Universe, each containing hundreds or even thousands of galaxies. Owing to the Sunyaev-Zel’dovich Effect these show up in the Planck data as compact regions of lower temperature in the cosmic microwave background. By surveying the whole sky, Planck stands the best chance of finding the most massive examples of these clusters. They are rare and their number is a sensitive probe of the kind of Universe we live in, how fast it is expanding, and how much matter it contains.

Credits: ESA/Planck Collaboration; XMM-Newton image: ESA

This image shows one of the newly discovered superclusters of galaxies, PLCK G214.6+37.0, detected by Planck and confirmed by XMM-Newton. This is the first supercluster to be discovered through its Sunyaev-Zel’dovich effect. The effect is the name for the cluster’s silhouette against the cosmic microwave background radiation. Combined with other observations, the Sunyaev-Zel’dovich effect allows astronomers to measure properties such as the temperature and density of the cluster’s hot gas where the galaxies are embedded. The right panel shows the X-ray image of the supercluster obtained with XMM-Newton, which reveals that three galaxy clusters comprise this supercluster. The bright orange blob in the left panel shows the Sunyaev-Zel’dovich image of the supercluster, obtained by Planck. The X-ray contours are also superimposed on the Planck image.

UPDATES: For other early perspectives on the early release results, see the blogs of Andrew Jaffe and Stuart Lowe; as usual, Jonathan Amos has done a very quick and well-written news piece for the BBC.


Share/Bookmark