Day Three of this meeting about “The Zel’dovich Universe” was slightly shorter than the previous two, in that it finished just after 17.00 rather than the usual 19.00 or later. That meant that we got out in time to settle down for a beer in time the World Cup football. I watched an excellent game between Nigeria and Argentina, which ended 3-2 to Argentina but could have been 7-7. I’ll use that as an excuse for writing a slightly shorter summary.
Anyway we began with a session on the Primordial Universe and Primordial Signatures led off by Alexei Starobinsky (although there is some controversy whether his name should end -y or -i). Starobinsky outlined the theory of cosmological perturbations from inflation with an emphasis on how it relates to some of Zel’dovich’s ideas on the subject. There was then a talk from Bruce Partridge about some of the results from Planck. I’ve mentioned already that this isn’t a typical cosmology conference, and this talk provided another unusual aspect in that there’s hardly been any discussion of the BICEP2 results here. When asked about at the end of his talk, Bruce replied (very sensibly) that we should all just be patient.
Next session after coffee was about cosmic voids, kicked off by Rien van de Weygaert with a talk entitled “Much Ado About Nothing”, which reminded me of the following quote from the play of the same name:
“He hath indeed better bettered expectation than you must expect of me to tell you how”
The existence of voids in the galaxy distribution is not unexpected given the presence of clusters and superclusters, but they are interesting in their own right as they display particular dynamical evolution and have important consequences on observations. In 1984, Vincent Icke proved the so-called “Bubble Theorem” which showed that an isolated underdensity tends to evolve to a spherical shape.Most cosmologists, including myself, therefore expected big voids to be round, which turns out to be wrong; the interaction of the perimeter of the void with its surroundings always plays an important role in determining the geometry. Another thing that sprang into my mind was a classic paper by Simon White (1979) with the abstract:
We derive and display relations which can be used to express many quantitative measures of clustering in terms of the hierarchy of correlation functions. The convergence rate and asymptotic behaviour of the integral series which usually result is explored as far as possible using the observed low-order galaxy correlation functions. On scales less than the expected nearest neighbour distance most clustering measures are influenced only by the lowest order correlation functions. On all larger scales their behaviour, in general, depends significantly on correlations of high order and cannot be approximated using the low-order functions. Bhavsar’s observed relation between density enhancement and the fraction of galaxies included in clusters is modelled and is shown to be only weakly dependent on high-order correlations over most of its range. The probability that a randomly placed region of given volume be empty is discussed as a particularly simple and appealing example of a statistic which is strongly influenced by correlations of all orders, and it is shown that this probability may obey a scaling law which will allow a test of the small-scale form of high-order correlations.
The emphasis is mine. It’s fascinating and somewhat paradoxical that we can learn a lot about the statistics of where the galaxies are fom the regions where galaxies are not.
Another thing worth mentioning was Paul Sutter’s discussion of a project on cosmic voids which is a fine example of open science. Check out the CosmicVoids website where you will find void catalogues, identification algorithms and a host of other stuff all freely available to anyone who wants to use them. This is the way forward.
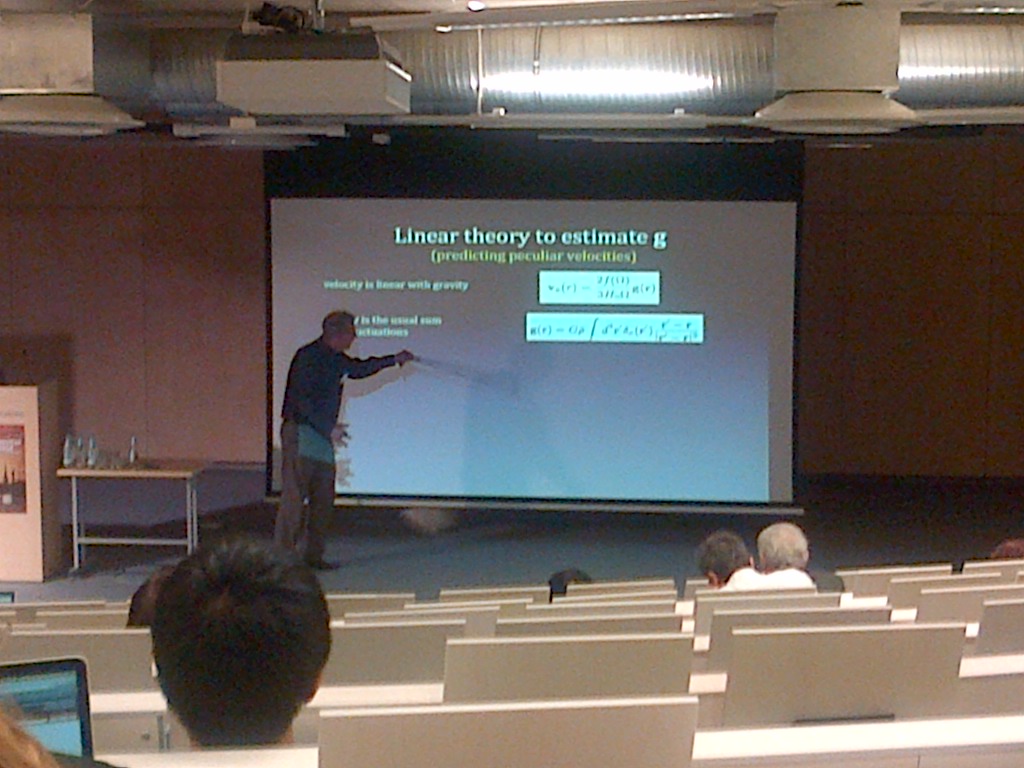
After lunch we had a session on Cosmic Flows, with a variety of talks about using galaxy peculiar velocities to understand the dynamics of large-scale structure. This field was booming about twenty years ago but which has been to some extent been overtaken by other cosmological probes that offer greater precision; the biggest difficulty has been getting a sufficient number of sufficiently accurate direct (redshift-independent) distance measurements to do good statistics. It remains a difficult but important field, because it’s important to test our models with as many independent methods as possible.
I’ll end with a word about the first speaker of this session, the Gruber prize winner Marc Davis. He suffered a stroke a few years ago which has left him partly paralysed (down his right side). He has battled back from this with great courage, and even turned it to his advantage during his talk when he complained about how faint the laser pointer was and used his walking stick instead.


 . In a fractal set, the mean number of neighbours of a given galaxy within a spherical volume of radius
  is proportional to
  . If galaxies are distributed uniformly (homogeneously) then
  , as the number of neighbours simply depends on the volume of the sphere, i.e. as
  , and the average number-density of galaxies. A value of
  indicates that the galaxies do not fill space in a homogeneous fashion:
  , for example, would indicate that galaxies were distributed in roughly linear structures (filaments); the mass of material distributed along a filament enclosed within a sphere grows linear with the radius of the sphere, i.e. as
  , not as its volume; galaxies distributed in sheets would have
  , and so on.
 on small scales (in cosmological terms, still several Megaparsecs), but the evidence for a turnover to
  has not been so strong, at least not until recently. It’s just just that measuring
  by
by  , give or take a factor of a few, so that a large fluctuation in the density of matter wouldn’t necessarily cause a large fluctuation of the metric unless it were on a scale
  reasonably large relative to the cosmological horizon
  . Galaxies correspond to a large
  but don’t violate the Cosmological Principle because they are too small in scale


 is the recession velocity,
  is the redshift,
  is Hubble’s constant and

 . The higher this number is, the more matter there is to generate peculiar motions so the more pronounced the alteration; in a low density universe, real and redshift space look rather similar.
