Archive for galaxies

Cosmic Clumpiness Conundra

Posted in The Universe and Stuff with tags , , , , , , , , , , , , , , on June 22, 2011 by telescoper

Well there’s a coincidence. I was just thinking of doing a post about cosmological homogeneity, spurred on by a discussion at the workshop I attended in Copenhagen a couple of weeks ago, when suddenly I’m presented with a topical hook to hang it on.

New Scientist has just carried a report about a paper by Shaun Thomas and colleagues from University College London the abstract of which reads

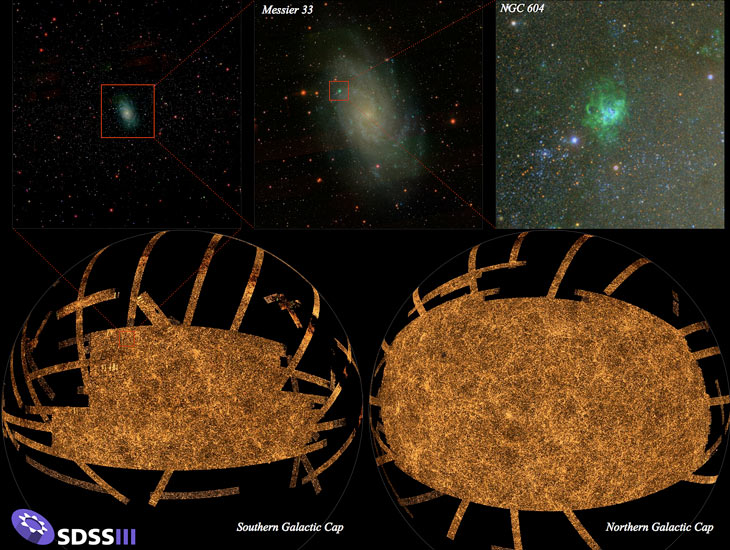
We observe a large excess of power in the statistical clustering of luminous red galaxies in the photometric SDSS galaxy sample called MegaZ DR7. This is seen over the lowest multipoles in the angular power spectra Cℓ in four equally spaced redshift bins between 0.4 \leq z \leq 0.65. However, it is most prominent in the highest redshift band at z\sim 4\sigma and it emerges at an effective scale k \sim 0.01 h{\rm Mpc}^{-1}. Given that MegaZ DR7 is the largest cosmic volume galaxy survey to date (3.3({\rm Gpc} h^{-1})^3) this implies an anomaly on the largest physical scales probed by galaxies. Alternatively, this signature could be a consequence of it appearing at the most systematically susceptible redshift. There are several explanations for this excess power that range from systematics to new physics. We test the survey, data, and excess power, as well as possible origins.

To paraphrase, it means that the distribution of galaxies in the survey they study is clumpier than expected on very large scales. In fact the level of fluctuation is about a factor two higher than expected on the basis of the standard cosmological model. This shows that either there’s something wrong with the standard cosmological model or there’s something wrong with the survey. Being a skeptic at heart, I’d bet on the latter if I had to put my money somewhere, because this survey involves photometric determinations of redshifts rather than the more accurate and reliable spectroscopic variety. I won’t be getting too excited about this result unless and until it is confirmed with a full spectroscopic survey. But that’s not to say it isn’t an interesting result.

For one thing it keeps alive a debate about whether, and at what scale, the Universe is homogeneous. The standard cosmological model is based on the Cosmological Principle, which asserts that the Universe is, in a broad-brush sense, homogeneous (is the same in every place) and isotropic (looks the same in all directions). But the question that has troubled cosmologists for many years is what is meant by large scales? How broad does the broad brush have to be?

At our meeting a few weeks ago, Subir Sarkar from Oxford pointed out that the evidence for cosmological homogeneity isn’t as compelling as most people assume. I blogged some time ago about an alternative idea, that the Universe might have structure on all scales, as would be the case if it were described in terms of a fractal set characterized by a fractal dimension D. In a fractal set, the mean number of neighbours of a given galaxy within a spherical volume of radius R is proportional to R^D. If galaxies are distributed uniformly (homogeneously) then D = 3, as the number of neighbours simply depends on the volume of the sphere, i.e. as R^3, and the average number-density of galaxies. A value of D < 3 indicates that the galaxies do not fill space in a homogeneous fashion: D = 1, for example, would indicate that galaxies were distributed in roughly linear structures (filaments); the mass of material distributed along a filament enclosed within a sphere grows linear with the radius of the sphere, i.e. as R^1, not as its volume; galaxies distributed in sheets would have D=2, and so on.

The discussion of a fractal universe is one I’m overdue to return to. In my previous post  I left the story as it stood about 15 years ago, and there have been numerous developments since then. I will do a “Part 2” to that post before long, but I’m waiting for some results I’ve heard about informally, but which aren’t yet published, before filling in the more recent developments.

We know that D \simeq 1.2 on small scales (in cosmological terms, still several Megaparsecs), but the evidence for a turnover to D=3 is not so strong. The point is, however, at what scale would we say that homogeneity is reached. Not when D=3 exactly, because there will always be statistical fluctuations; see below. What scale, then?  Where D=2.9? D=2.99?

What I’m trying to say is that much of the discussion of this issue involves the phrase “scale of homogeneity” when that is a poorly defined concept. There is no such thing as “the scale of homogeneity”, just a whole host of quantities that vary with scale in a way that may or may not approach the value expected in a homogeneous universe.

It’s even more complicated than that, actually. When we cosmologists adopt the Cosmological Principle we apply it not to the distribution of galaxies in space, but to space itself. We assume that space is homogeneous so that its geometry can be described by the Friedmann-Lemaitre-Robertson-Walker metric.

According to Einstein’s  theory of general relativity, clumps in the matter distribution would cause distortions in the metric which are roughly related to fluctuations in the Newtonian gravitational potential \delta\Phi by \delta\Phi/c^2 \sim \left(\lambda/ct \right)^{2} \left(\delta \rho/\rho\right), give or take a factor of a few, so that a large fluctuation in the density of matter wouldn’t necessarily cause a large fluctuation of the metric unless it were on a scale \lambda reasonably large relative to the cosmological horizon \sim ct. Galaxies correspond to a large \delta \rho/\rho \sim 10^6 but don’t violate the Cosmological Principle because they are too small to perturb the background metric significantly. Even the big clumps found by the UCL team only correspond to a small variation in the metric. The issue with these, therefore, is not so much that they threaten the applicability of the Cosmological Principle, but that they seem to suggest structure might have grown in a different way to that usually supposed.

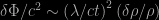
The problem is that we can’t measure the gravitational potential on these scales directly so our tests are indirect. Counting galaxies is relatively crude because we don’t even know how well galaxies trace the underlying mass distribution.

An alternative way of doing this is to use not the positions of galaxies, but their velocities (usually called peculiar motions). These deviations from a pure Hubble flow are caused by lumps of matter pulling on the galaxies; the more lumpy the Universe is, the larger the velocities are and the larger the lumps are the more coherent the flow becomes. On small scales galaxies whizz around at speeds of hundreds of kilometres per second relative to each other, but averaged over larger and larger volumes the bulk flow should get smaller and smaller, eventually coming to zero in a frame in which the Universe is exactly homogeneous and isotropic.

Roughly speaking the bulk flow v should relate to the metric fluctuation as approximately \delta \Phi/c^2 \sim \left(\lambda/ct \right) \left(v/c\right).

It has been claimed that some observations suggest the existence of a dark flow which, if true, would challenge the reliability of the standard cosmological framework, but these results are controversial and are yet to be independently confirmed.

But suppose you could measure the net flow of matter in spheres of increasing size. At what scale would you claim homogeneity is reached? Not when the flow is exactly zero, as there will always be fluctuations, but exactly how small?

The same goes for all the other possible criteria we have for judging cosmological homogeneity. We are free to choose the point where we say the level of inhomogeneity is sufficiently small to be satisfactory.

In fact, the standard cosmology (or at least the simplest version of it) has the peculiar property that it doesn’t ever reach homogeneity anyway! If the spectrum of primordial perturbations is scale-free, as is usually supposed, then the metric fluctuations don’t vary with scale at all. In fact, they’re fixed at a level of \delta \Phi/c^2 \sim 10^{-5}.

The fluctuations are small, so the FLRW metric is pretty accurate, but don’t get smaller with increasing scale, so there is no point when it’s exactly true. So lets have no more of “the scale of homogeneity” as if that were a meaningful phrase. Let’s keep the discussion to the behaviour of suitably defined measurable quantities and how they vary with scale. You know, like real scientists do.

No Cox please, we’re British…

Posted in Television, The Universe and Stuff with tags , , , , , , , on March 29, 2011 by telescoper

The final episode of the BBC television series Wonders of the Universe was broadcast this weekend. Apparently it’s been incredibly popular, winning huge plaudits for its presenter Brian Cox, and perhaps inspiring the next generation of budding cosmologists the way Carl Sagan did thirty-odd years ago with his series Cosmos.

Grumpy old cosmologists (i.e. people like myself) who have watched it are a bit baffled by the peculiar choices of location – seemingly chosen simply in order to be expensive, without any relevance to the topic being discussed – the intrusive (and rather ghastly) music, and the personality cult generated by the constant focus on the dreamy-eyed presenter. But of course the series wasn’t made for people like us, so we’ve got no right to complain. If he does a great job getting the younger generation interested in science, then that’s enough for me. I can always watch Miss Marple on the other side instead.

But walking into work this morning I suddenly realised the real reason why I don’t really like Wonders of the Universe. It’s got nothing to do with the things I mentioned above. It’s because it’s just not British enough.

I’m not saying that Brian Cox isn’t British. Obviously he is. Although I do quibble with him being labelled as a “northerner”. Actually, he’s from Manchester. The North is in fact that part of England that extends southwards from the Scottish border to the Tyne. The Midlands start with Gateshead and include Yorkshire, Manchester and Liverpool and all those places whose inhabitants wish they were from the North, but aren’t really hard enough.

Anyway, I just put that bit in to inform non-British readers of this blog about the facts of UK geography. It’s not really relevant to the main point of the piece.

The problem with Wonders of the Universe is betrayed by its title. The word “wonders” suggests that the Universe is wonder-ful, or even, in a word which has cropped up in the series a few times, “awesome”. No authentic British person, and certainly not one who’s forty-something, would ever use the word “awesome” without being paid a lot of money to do so. It just doesn’t ring true.

I reckon it doesn’t do to be too impressed by anything on TV these days (especially if its accompanied by awful music), but there is a particularly good reason for not being taken in by all this talk about “Wonders”, and that is that the Universe is basically a load of rubbish.

Take this thing, for example.

It’s a galaxy (the Andromeda Nebula, M31, to be precise). We live in a similar article, in fact. Of course it looks quite pretty on the surface, but when you look at them with a physicist’s eye galaxies are really not all they’re cracked up to be.

We live in a relatively crowded part of our galaxy on a small planet orbiting a fairly insignificant star called the Sun. Now you’ve got me started on the Sun. I know it supplies the Earth with all its energy, but it does so pretty badly, all things considered. The Sun only radiates a fraction of a milliwatt per kilogram. That’s hopeless! Pound for pound, a human being radiates more than a thousand times as much. All in all, stars are drastically overrated: bloated, wasteful, inefficient and  not even slightly awesome. They’re only noticeable because they’re big. And we all know that size shouldn’t really matter.

But even in what purports to be an interesting neighbourhood of our Galaxy, the nearest star is 4.5 light years from the Sun. To get that in perspective, imagine the Sun is the size of a golfball. On the same scale, where is the nearest star?

The answer to that will probably surprise you, as it does my students when I give this example in lectures. The answer is, in fact, on the order of a thousand kilometres away. That’s the distance from Cardiff to, say, Munich. What a dull landscape our Galaxy possesses. In between one little golf ball in Wales and another one in Germany there’s nothing of any interest at all, just a featureless incomprehensible void not worthy of the most perfunctory second thought; it’s usually called France.

So galaxies aren’t dazzlingly beautiful jewels of the heavens. They’re flimsy, insubstantial things more like the cheap tat you can find on QVC. What’s worse is that they’re also full of a grubby mixture of soot and dust. Indeed, some are so filthy that you can hardly see any stars at all. Somebody needs to give the Universe a good clean. I suppose you just can’t get the help these days.

And then there’s the Big Bang. Well, I don’t need to go on about that because I’ve already posted about it. Suffice to say that the Big Bang wasn’t anywhere near as Big as you’ve been led to believe. The volume was between about 115 and 120 decibels. Quite loud, but many rock concerts are louder. Very disappointing. If I’d been in charge I would have put on something much more spectacular.

In any case the Big Bang happened a very long time ago. The Universe is now a cold and desolate place, lit by a few feeble stars and warmed only by the fading glow of the heat given off when it was all so much younger and more exciting. It’s as if we inhabit a shabby downmarket retirement home, warmed only by the feeble radiation given off by a puny electric fire as we occupy ourselves as best we can until Armageddon comes.

No, the Universe isn’t wonderful at all. In fact, it’s basically a bit crummy. It’s only superficially impressive because it’s quite large, and it doesn’t do to be impressed by things just because they are large. That would be vulgar.

Digression: I just remembered a story about a loudmouthed Texan who owned a big ranch and who was visiting the English countryside on holiday. Chatting to locals in the village pub he boasted that it took him several days to drive around his ranch. A farmer replied “Yes. I used to have a car like that.”

We British just don’t like showy things. It’s in our genes. We’re fundamentally a rather drab and dowdy race. We don’t really enjoy being astonished either. We prefer things we can find fault with over things that intimidate us with their splendour. We’re much more likely to tut disapprovingly than stare open-mouthed in amazement at something that seems pointlessly ostentatious. If pushed, we might even write a letter of complaint to the Council.

Ultimately, however, the fact is that whatever we think about it, we’re stuck with it. Just like the trains, the government and the weather. Nothing we can do about it, so we might as well just soldier on. That’s the British way.

So you can rest assured that none of this Wonders of the Universe stuff will distract us for long from getting on with the important things in life, such as watching Coronation Street.

Professor Brian Cox is 43.


Share/Bookmark


What is a Galaxy?

Posted in The Universe and Stuff with tags , , , , , , on January 19, 2011 by telescoper

An interesting little paper by Duncan Forbes and  Pavel Kroupa appeared today on the arXiv today. It asks what you would have thought was the rather basic question “What is a Galaxy?”. Like many basic questions, however, it turns out to be much  more complicated than you imagined.

Ask most people what they think a galaxy is and they’ll think of something like Andromeda (or M31), shown on the left, with its lovely spiral arms. But galaxies exist in many different types, which have quite different morphologies, dynamical properties and stellar populations.

The paper by Forbes and Kroupa lists examples of definitions from technical articles and elsewhere. The Oxford English Dictionary, for instance, gives

Any of the numerous large groups of stars and other
matter that exist in space as independent systems.

I suppose that is OK, but isn’t very  precise. How do you define “independent”, for example? Two galaxies orbiting in a binary system aren’t independent, but you would still want to count them as two galaxies rather than one. A group or cluster of galaxies is likewise not a single large galaxy, at least not by any useful definition. At the other extreme, what about a cluster of stars or even a binary star system? Why aren’t they regarded as gaaxies too? They are (or can be) gravitationally bound..

Clearly we have a particular size in mind, but even if we restrict ourselves to “galaxy-sized” objects we still have problems. Why is a globular cluster not a small galaxy while a dwarf galaxy is?

To be perfectly honest, I don’t really care very much about nomenclature. A rose by any other name would smell as sweet, and a galaxy by any other name would be just as luminous. What really counts are the physical properties of the various astronomical systems we find because these are what have to be explained by astrophysicists.

Perhaps it would be better to adopt Judge Potter Stewart‘s approach. Asked to rule on an obscenity case, he wrote that hard-core pornography was difficult to define, but ” I know it when I see it”….

As a cosmologist I tend to think that there’s only one system that really counts – the Universe, and galaxies are just bits of the Universe where stars seemed to have formed and organised themselves into interesting shapes. Galaxies may be photogenic, nice showy things for impressing people, but they aren’t really in themselves all that important in the cosmic scheme of things. They’re just the Big Bang’s bits of bling.

I’m not saying that galaxies aren’t extremely useful for telling us about the Universe; they clearly are. They shed light (literally) on a great many things that we wouldn’t otherwise have any clue about. Without them we couldn’t even have begun to do cosmology, and they still provide some of the most important evidence in the ongoing investigation of the the nature of the Universe. However, I think what goes on in between the shiny bits is actually much more interesting from the point of view of fundamental physics than the shiny things themselves.

Anyway, I’m rambling again and I can hear the observational astronomers swearing at me through their screens, so let me move on to the fun bit of the paper I was discussing, which is that the authors list a number of possible definitions of a galaxy and invite readers to vote.

For your information, the options (discussed in more detail in the paper) for the minimum criteria to define a galaxy are:

  • The relaxation time is greater than the age of the Universe
  • The half-light radius is greater than 10 parsecs
  • The presence of complex stellar systems
  • The presence of dark matter
  • Hosts a satellite stellar system

I won’t comment on the grammatical inconsistency of these statements. Or perhaps I just did. I’m not sure these would have been my choices either, but there you are. There’s an option to add your own criteria anyway.

The poll can be found here.

Get voting!

UPDATE: In view of the reaction some of my comments have generated from galactic astronomers I’ve decided to add a poll of my own, so that readers of this blog can express their opinions in a completely fair and unbiased way:


Share/Bookmark

SDSS-III and the Cosmic Web

Posted in The Universe and Stuff with tags , , , , , on January 12, 2011 by telescoper

It’s typical, isn’t it? You wait weeks for an interesting astronomical result to blog about and then two come along together…

Another international conference I’m not at is the 217th Meeting of the American Astronomical Society in the fine city of Seattle, which yesterday saw the release of some wonderful things produced by SDSS-III, the third incarnation of the Sloan Digital Sky Survey. There’s a nice article about it in the Guardian, followed by the usual bizarre selection of comments from the public.

I particularly liked the following picture of the cosmic web of galaxies, clusters and filaments that pervades the Universe on scales of hundreds of millions of lightyears, although it looks to me like a poor quality imitation of a Jackson Pollock action painting:

The above image contains about 500 million galaxies, which represents an enormous advance in the quest to map the local structure of the Universe in as much detail as possible. It will also improve still further the precision with which cosmologists can analyse the statistical properties of the pattern of galaxy clustering.

The above represents only a part (about one third) of the overall survey; the following graphic shows how much of the sky has been mapped. It also represents only the imaging data, not the spectroscopic information and other information which is needed to analyse the galaxy distribution in full detail.

There’s also a short video zooming out from one galaxy to the whole Shebang.

The universe is a big place.


Share/Bookmark

First Science from Planck

Posted in The Universe and Stuff with tags , , , , , , , , , on January 11, 2011 by telescoper

It’s been quite a long wait for results to emerge from the Planck satellite, which was launched in May 2009, but today the first science results have at last been released. These aren’t to do with the cosmological aspects of the mission – those will have to wait another two years – but things we cosmologists tend to think of as “foregrounds”, although they are of great astrophysical interest in themselves.

For an overview, with lots of pretty pictures,  see the European Space Agency’s Planck site and the UK Planck outreach site; you can also watch this morning’s press briefing in full here.

A repository of all 25 science papers can be found here and there’ll no doubt be a deluge of them on the arXiv tomorrow.

A few of my Cardiff colleagues are currently in Paris living it up at the junket working hard at the serious scientific conference at which these results are being discussed. I, on the other hand, not being one of the in-crowd, am back here in Cardiff, only have a short window in between meetings, project vivas and postgraduate lectures  to comment on the new data. I’m also sure there’ll be a huge amount of interest in the professional media and in the blogosphere for some time to come. I’ll therefore just mention a couple of things that struck me immediately as I went quickly through the papers while I was eating my sandwich; the following was cobbled together from the associated ESA press release.

The first concerns the so-called  ‘anomalous microwave emission’ (aka Foreground X) , which is a diffuse glow most strongly associated with the dense, dusty regions of our Galaxy. Its origin has been a puzzle for decades, but data collected by Planck seem to confirm the theory that it comes from rapidly spinning dust grains. Identifying the source of this emission will help Planck scientists remove foreground contamination which much greater precision, enabling them to construct much cleaner maps of the cosmic microwave background and thus, among other things, perhaps clarify the nature of the various apparent anomalies present in current cosmological data sets.

Here’s a nice composite image of a region of anomalous emission, alongside individual maps derived from low-frequency radio observations as well as two of the Planck channels (left).

Credits: ESA/Planck Collaboration

The colour composite of the Rho Ophiuchus molecular cloud highlights the correlation between the anomalous microwave emission, most likely due to miniature spinning dust grains observed at 30 GHz (shown here in red), and the thermal dust emission, observed at 857 GHz (shown here in green). The complex structure of knots and filaments, visible in this cloud of gas and dust, represents striking evidence for the ongoing processes of star formation. The composite image (right) is based on three individual maps (left) taken at 0.4 GHz from Haslam et al. (1982) and at 30 GHz and 857 GHz by Planck, respectively. The size of the image is about 5 degrees on a side, which is about 10 times the apparent diameter of the full Moon.

The second of the many other exciting results presented today that I wanted to mention is a release of new data on clusters of galaxies – the largest structures in the Universe, each containing hundreds or even thousands of galaxies. Owing to the Sunyaev-Zel’dovich Effect these show up in the Planck data as compact regions of lower temperature in the cosmic microwave background. By surveying the whole sky, Planck stands the best chance of finding the most massive examples of these clusters. They are rare and their number is a sensitive probe of the kind of Universe we live in, how fast it is expanding, and how much matter it contains.

Credits: ESA/Planck Collaboration; XMM-Newton image: ESA

This image shows one of the newly discovered superclusters of galaxies, PLCK G214.6+37.0, detected by Planck and confirmed by XMM-Newton. This is the first supercluster to be discovered through its Sunyaev-Zel’dovich effect. The effect is the name for the cluster’s silhouette against the cosmic microwave background radiation. Combined with other observations, the Sunyaev-Zel’dovich effect allows astronomers to measure properties such as the temperature and density of the cluster’s hot gas where the galaxies are embedded. The right panel shows the X-ray image of the supercluster obtained with XMM-Newton, which reveals that three galaxy clusters comprise this supercluster. The bright orange blob in the left panel shows the Sunyaev-Zel’dovich image of the supercluster, obtained by Planck. The X-ray contours are also superimposed on the Planck image.

UPDATES: For other early perspectives on the early release results, see the blogs of Andrew Jaffe and Stuart Lowe; as usual, Jonathan Amos has done a very quick and well-written news piece for the BBC.


Share/Bookmark

A Main Sequence for Galaxies?

Posted in Bad Statistics, The Universe and Stuff with tags , , , , , on December 2, 2010 by telescoper

Not for the first time in my life I find myself a bit of a laughing stock, after blowing my top during a seminar at Cardiff yesterday by retired Professor Mike Disney. In fact I got so angry that, much to the amusement of my colleagues, I stormed out. I don’t often lose my temper, and am not proud of having done so, but I reached a point when the red mist descended. What caused it was bad science and, in particular, bad statistics. It was all a big pity because what could have been an interesting discussion of an interesting result was ruined by too many unjustified assertions and too little attention to the underlying basis of the science. I still believe that no matter how interesting the results are, it’s  the method that really matters.

The interesting result that Mike Disney talked about emerges from a Principal Components Analysis (PCA) of the data relating to a sample of about 200 galaxies; it was actually published in Nature a couple of years ago; the arXiv version is here. It was the misleading way this was discussed in the seminar that got me so agitated so I’ll give my take on it now that I’ve calmed down to explain what I think is going on.

In fact, Principal Component Analysis is a very simple technique and shouldn’t really be controversial at all. It is a way of simplifying the representation of multivariate data by looking for the correlations present within it. To illustrate how it works, consider the following two-dimensional (i.e. bivariate) example I took from a nice tutorial on the method.

In this example the measured variables are Pressure and Temperature. When you plot them against each other you find they are correlated, i.e. the pressure tends to increase with temperature (or vice-versa). When you do a PCA of this type of dataset you first construct the covariance matrix (or, more precisely, its normalized form the correlation matrix). Such matrices are always symmetric and square (i.e. N×N, where N is the number of measurements involved at each point; in this case N=2) . What the PCA does is to determine the eigenvalues and eigenvectors of the correlation matrix.

The eigenvectors for the example above are shown in the diagram – they are basically the major and minor axes of an ellipse drawn to fit the scatter plot; these two eigenvectors (and their associated eigenvalues) define the principal components as linear combinations of the original variables. Notice that along one principal direction (v1) there is much more variation than the other (v2). This means that most of the variance in the data set is along the direction indicated by the vector v1, and relatively little in the orthogonal direction v2; the eigenvalue for the first vector is consequently larger than that for the second.

The upshot of this is that the description of this (very simple) dataset can be compressed by using the first principal component rather than the original variables, i.e. by switching from the original two variables (pressure and temperature) to one variable (v1) we have compressed our description without losing much information (only the little bit that is involved in the scatter in the v2 direction.

In the more general case of N observables there will be N principal components, corresponding to vectors in an N-dimensional space, but nothing changes qualitatively. What the PCA does is to rank the eigenvectors according to their eigenvalue (i.e. the variance associated with the direction of the eigenvector). The first principal component is the one with the largest variance, and so on down the ordered list.

Where PCA is useful with large data sets is when the variance associated with the first (or first few) principal components is very much larger than the rest. In that case one can dispense with the N variables and just use one or two.

In the cases discussed by Professor Disney yesterday the data involved six measurable parameters of each galaxy: (1) a dynamical mass estimate; (2) the mass inferred from HI emission (21cm); (3) the total luminosity; (4) radius; (5) a measure of the central concentration of the galaxy; and (6) a measure of its colour. The PCA analysis of these data reveals that about 80% of the variance in the data set is associated with the first principal component, so there is clearly a significant correlation present in the data although, to be honest, I have seen many PCA analyses with much stronger concentrations of variance in the first eigenvector so it doesn’t strike me as being particularly strong.

However, thinking as a physicist rather than a statistician there is clearly something very interesting going on. From a theoretical point of view one would imagine that the properties of an individual galaxy might be controlled by as many as six independent parameters including mass, angular momentum, baryon fraction, age and size, as well as by the accidents of its recent haphazard merger history.

Disney et al. argue that for gaseous galaxies to appear as a one-parameter set, as observed here, the theory of galaxy formation and evolution must supply at least five independent constraint equations in order to collapse everything into a single parameter.

This is all vaguely reminiscent of the Hertzsprung-Russell diagram, or at least the main sequence thereof:


You can see here that there’s a correlation between temperature and luminosity which constrains this particular bivariate data set to lie along a (nearly) one-dimensional track in the diagram. In fact these properties correlate with each other because there is a single parameter model relating all properties of main sequence stars to their mass. In other words, once you fix the mass of a main sequence star, it has a fixed  luminosity, temperature, and radius (apart from variations caused by age, metallicity, etc). Of course the problem is that masses of stars are difficult to determine so this parameter is largely hidden from the observer. What is really happening is that luminosity and temperature correlate with each other, because they both depend on the  hidden parameter mass.

I don’t think that the PCA result disproves the current theory of hierarchical galaxy formation (which is what Disney claims) but it will definitely be a challenge for theorists to provide a satisfactory explanation of the result! My own guess for the physical parameter that accounts for most of the variation in this data set is the mass of the dark halo within which the galaxy is embedded. In other words, it might really be just like the Hertzsprung-Russell diagram…

But back to my argument with Mike Disney. I asked what is the first principal component of the galaxy data, i.e. what does the principal eigenvector look like? He refused to answer, saying that it was impossible to tell. Of course it isn’t, as the PCA method actually requires it to be determined. Further questioning seemed to reveal a basic misunderstanding of the whole idea of PCA which made the assertion that all of modern cosmology would need to be revised somewhat difficult to swallow.  At that point of deadlock, I got very angry and stormed out.

I realise that behind the confusion was a reasonable point. The first principal component is well-defined, i.e. v1 is completely well defined in the first figure. However, along the line defined by that vector, P and T are proportional to each other so in a sense only one of them is needed to specify a position along this line. But you can’t say on the basis of this analysis alone that the fundamental variable is either pressure or temperature; they might be correlated through a third quantity you don’t know about.

Anyway, as a postscript I’ll say I did go and apologize to Mike Disney afterwards for losing my rag. He was very forgiving, although I probably now have a reputation for being a grumpy old bastard. Which I suppose I am. He also said one other thing,  that he didn’t mind me getting angry because it showed I cared about the truth. Which I suppose I do.


Share/Bookmark

Finding Gravitational Lenses, the Herschel Way…

Posted in The Universe and Stuff with tags , , , , , , on November 4, 2010 by telescoper

It’s nice to have the chance to blog for once about some exciting astrophysics rather than doom and gloom about budget cuts. Tomorrow (5th November) sees the publication of a long-awaited article (by Negrello et al.)  in the journal Science (abstract here) that presents evidence of discovery of a number of new gravitational lens systems using the Herschel Space Observatory.

There is a press release accompanying this paper on the  Cardiff University website, and a longer article on the Herschel Outreach website, from which I nicked the following nice graphic (click on it for a bigger version).

This shows rather nicely how a gravitational lens works: it’s basically a concentration of matter (in this case a galaxy) along the line of sight from the observer to a background source (in this case another galaxy). Light from the background object gets bent by the foreground object, forming multiple  images which are usually both magnified and distorted. Gravitational lensing itself is not a new discovery but what is especially interesting about the new results are that they suggest a much more efficient way of finding lensed systems than we have previously had.

In the past they have usually been found by laboriously scouring optical (or sometimes radio) images of very faint galaxies. A candidate lens (perhaps a close-set group of images with similar colours), then this candidate is followed up with detailed spectroscopy to establish whether the images are actually all at the same redshift, which they should be if they are part of a lens system. Unfortunately, only about one-in-ten of candidate lens systems found this way turn out to be actual lenses, so this isn’t a very efficient way of finding them. Even multiple needles are hard to find in a haystack.

The new results have emerged from a large survey, called H-ATLAS, of galaxies detected in the far-infrared/submillimetre part of the spectrum. Even the preliminary stages of this survey covered a sufficiently large part of the sky – and sufficiently many galaxies within the region studied – to suggest  the presence of a significant population of galaxies that bear all the hallmarks of being lensed.

The new Science article discusses five surprisingly bright objects found early on during the course of the H-ATLAS survey. The galaxies found with optical telescopes in the directions of these sources would not normally be expected to be bright at the far-infrared wavelengths observed by Herschel. This suggested that the galaxies seen in visible light might be gravitational lenses magnifying much more distant background galaxies seen by Herschel. With the relatively poor resolution that comes from working at long wavelengths, Herschel can’t resolve the individual images produced by the lens, but does collect more photons from a lensed galaxy than an unlensed one, so it appears much brighter in the detectors.


Detailed spectroscopic follow-up using ground-based radio and sub-millimetre telescopes confirmed these ideas :  the galaxies seen by the optical telescopes are much closer, each ideally positioned to create gravitational lenses.

These results demonstrate that gravitational lensing is probably at work in all the distant and bright galaxies seen by Herschel. This in turn, suggests that in the full H-ATLAS survey might provide huge numbers of gravitational lens systems, enough to perform a number of powerful statistical tests of theories of galaxy formation and evolution. It’s a bit of a cliché to say so, but it looks like Herschel will indeed open up a new window on the distant Universe.

P.S. For the record, although I’m technically a member of the H-ATLAS consortium, I was not directly involved in this work and am not among the authors.

P.P.S. This announcement also gives me the opportunity to pass on the information that all the data arising from the H-ATLAS science demonstration phase is now available online for you to play with!


Share/Bookmark

Back Early…

Posted in The Universe and Stuff with tags , , , , , on September 11, 2009 by telescoper

As a very quick postscript to my previous post about the amazing performance of Hubble’s spanking new camera, let me just draw attention to a fresh paper on the ArXiv by Rychard Bouwens and collaborators, which discusses the detection of galaxies with redshifts around 8 in the Hubble Ultra Deep Field (shown below in an earlier image) using WFC3/IR observations that reveal galaxies fainter than the previous detection limits.

Amazing. I remember the days when a redshift z=0.5 was a big deal!

To put this in context and to give some idea of its importance, remember that the redshift z is defined in such a way that 1+z is the factor by which the wavelength of light is stretched out by the expansion of the Universe. Thus, a photon from a galaxy at redshift 8 started out on its journey towards us (or, rather, the Hubble Space Telescope) when the Universe was compressed in all directions relative to its present size by a factor of 9. The average density of stuff then was a factor 93=729 larger, so the Universe was a much more crowded place then compared to what it’s like now.

Translating the redshift into a time is trickier because it requires us to know how the expansion rate of the Universe varies with cosmic epoch. The requires solving the equations of a cosmological model or, more realistically for a Friday afternoon, plugging the numbers into Ned Wright’s famous cosmology calculator.

Using the best-estimate parameters for the current concordance cosmology reveals that at redshift 8, the Universe was only about 0.65 billion years old (i.e. light from the distant galaxies seen by HST set out only 650 million years after the Big Bang). Since the current age of the Universe is about 13.7 billion years (according to the same model), this means that the light Hubble detected set out on its journey towards us an astonishing 13 billion years ago.

More importantly for theories of galaxy formation and evolution, this means that at least some galaxies must have formed very early on, relatively speaking, in the first 5% of the time the Universe has been around for until now.

These observations are by no means certain as the redshifts have been determined only approximately using photometric techniques rather than the more accurate spectroscopic methods, but if they’re correct they could be extremely important.

At the very least they provide even stronger motivation for getting on with the next-generation space telescope, JWST.