I was very unimpressed by yesterday’s batch of April Fool jokes. Some of them were just too obvious:
 I’m glad I didn’t try to do one.
Anyway, I noticed that an old post of mine was getting some traffic and when I investigated I found that some of the links to pictures were dead. So I’ve decided to refresh it and post again.
–0–
I’ve got a thing about randomness. For a start I don’t like the word, because it covers such a multitude of sins. People talk about there being randomness in nature when what they really mean is that they don’t know how to predict outcomes perfectly. That’s not quite the same thing as things being inherently unpredictable; statements about the nature of reality are ontological, whereas I think randomness is only a useful concept in an epistemological sense. It describes our lack of knowledge: just because we don’t know how to predict doesn’t mean that it can’t be predicted.
Nevertheless there are useful mathematical definitions of randomness and it is also (somtimes) useful to make mathematical models that display random behaviour in a well-defined sense, especially in situations where one has to take into account the effects of noise.
I thought it would be fun to illustrate one such model. In a point process, the random element is a “dot” that occurs at some location in time or space. Such processes occur in wide range of contexts: arrivals of buses at a bus stop, photons in a detector, darts on a dartboard, and so on.
Let us suppose that we think of such a process happening in time, although what follows can straightforwardly be generalised to things happening over an area (such a dartboard) or within some higher-dimensional region. It is also possible to invest the points with some other attributes; processes like this are sometimes called marked point processes, but I won’t discuss them here.
The “most” random way of constructing a simple point process is to assume that each event happens independently of every other event, and that there is a constant probability per unit time of an event happening. This type of process is called a Poisson process, after the French mathematician Siméon-Denis Poisson, who was born in 1781. He was one of the most creative and original physicists of all time: besides fundamental work on electrostatics and the theory of magnetism for which he is famous, he also built greatly upon Laplace’s work in probability theory. His principal result was to derive a formula giving the number of random events if the probability of each one is very low. The Poisson distribution, as it is now known and which I will come to shortly, is related to this original calculation; it was subsequently shown that this distribution amounts to a limiting of the binomial distribution. Just to add to the connections between probability theory and astronomy, it is worth mentioning that in 1833 Poisson wrote an important paper on the motion of the Moon.
In a finite interval of duration T the mean (or expected) number of events for a Poisson process will obviously just be proportional to the product of the rate per unit time and T itself; call this product λ.
The full distribution is then of the form:

This gives the probability that a finite interval contains exactly x events. It can be neatly derived from the binomial distribution by dividing the interval into a very large number of very tiny pieces, each one of which becomes a Bernoulli trial. The probability of success (i.e. of an event occurring) in each trial is extremely small, but the number of trials becomes extremely large in such a way that the mean number of successes is l. In this limit the binomial distribution takes the form of the above expression. The variance of this distribution is interesting: it is alsol. This means that the typical fluctuations within the interval are of order the square root of l on a mean level of l, so the fractional variation is of the famous “one over root n” form that is a useful estimate of the expected variation in point processes. Indeed, it’s a useful rule-of-thumb for estimating likely fluctuation levels in a host of statistical situations.
If football were a Poisson process with a mean number of goals per game of, say, 2 then would expect must games to have 2 plus or minus 1.4 (the square root of 2) goals, i.e. between about 0.6 and 3.4. That is actually not far from what is observed and the distribution of goals per game in football matches is actually quite close to a Poisson distribution.
This idea can be straightforwardly extended to higher dimensional processes. If points are scattered over an area with a constant probability per unit area then the mean number in a finite area will also be some number l and the same formula applies.
As a matter of fact I first learned about the Poisson distribution when I was at school, doing A-level mathematics (which in those days actually included some mathematics). The example used by the teacher to illustrate this particular bit of probability theory was a two-dimensional one from biology. The skin of a fish was divided into little squares of equal area, and the number of parasites found in each square was counted. A histogram of these numbers accurately follows the Poisson form. For years I laboured under the delusion that it was given this name because it was something to do with fish, but then I never was very quick on the uptake.
This is all very well, but point processes are not always of this Poisson form. Points can be clustered, so that having one point at a given position increases the conditional probability of having others nearby. For example, galaxies like those shown in the nice picture are distributed throughout space in a clustered pattern that is very far from the Poisson form. But it’s very difficult to tell from just looking at the picture. What is needed is a rigorous statistical analysis.

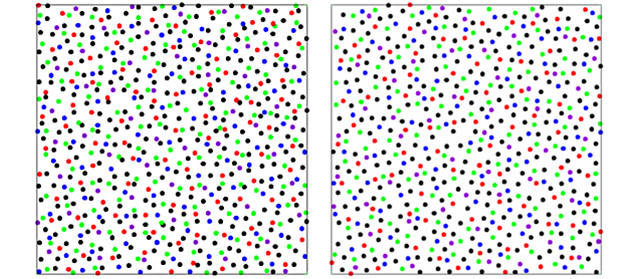
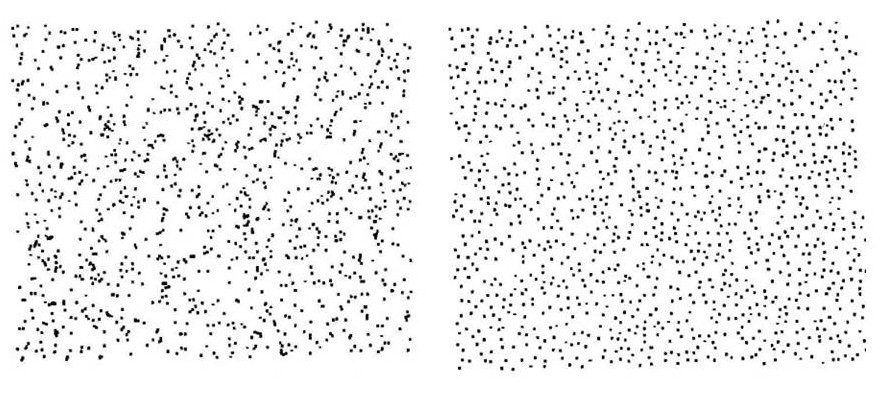
The statistical description of clustered point patterns is a fascinating subject, because it makes contact with the way in which our eyes and brain perceive pattern. I’ve spent a large part of my research career trying to figure out efficient ways of quantifying pattern in an objective way and I can tell you it’s not easy, especially when the data are prone to systematic errors and glitches. I can only touch on the subject here, but to see what I am talking about look at the two patterns below:


You will have to take my word for it that one of these is a realization of a two-dimensional Poisson point process and the other contains correlations between the points. One therefore has a real pattern to it, and one is a realization of a completely unstructured random process.
I show this example in popular talks and get the audience to vote on which one is the random one. The vast majority usually think that the top is the one that is random and the bottom one is the one with structure to it. It is not hard to see why. The top pattern is very smooth (what one would naively expect for a constant probability of finding a point at any position in the two-dimensional space) , whereas the bottom one seems to offer a profusion of linear, filamentary features and densely concentrated clusters.
In fact, it’s the bottom picture that was generated by a Poisson process using a Monte Carlo random number generator. All the structure that is visually apparent is imposed by our own sensory apparatus, which has evolved to be so good at discerning patterns that it finds them when they’re not even there!
The top process is also generated by a Monte Carlo technique, but the algorithm is more complicated. In this case the presence of a point at some location suppresses the probability of having other points in the vicinity. Each event has a zone of avoidance around it; the points are therefore anticorrelated. The result of this is that the pattern is much smoother than a truly random process should be. In fact, this simulation has nothing to do with galaxy clustering really. The algorithm used to generate it was meant to mimic the behaviour of glow-worms which tend to eat each other if they get too close. That’s why they spread themselves out in space more uniformly than in the random pattern.
Incidentally, I got both pictures from Stephen Jay Gould’s collection of essays Bully for Brontosaurus and used them, with appropriate credit and copyright permission, in my own book From Cosmos to Chaos. I forgot to say this in earlier versions of this post.
The tendency to find things that are not there is quite well known to astronomers. The constellations which we all recognize so easily are not physical associations of stars, but are just chance alignments on the sky of things at vastly different distances in space. That is not to say that they are random, but the pattern they form is not caused by direct correlations between the stars. Galaxies form real three-dimensional physical associations through their direct gravitational effect on one another.
People are actually pretty hopeless at understanding what “really” random processes look like, probably because the word random is used so often in very imprecise ways and they don’t know what it means in a specific context like this. The point about random processes, even simpler ones like repeated tossing of a coin, is that coincidences happen much more frequently than one might suppose.
I suppose there is an evolutionary reason why our brains like to impose order on things in a general way. More specifically scientists often use perceived patterns in order to construct hypotheses. However these hypotheses must be tested objectively and often the initial impressions turn out to be figments of the imagination, like the canals on Mars.
Now, I think I’ll complain to wordpress about the widget that links pages to a “random blog post”. I’m sure it’s not really random….
Follow @telescoper