Archive for the Bad Statistics Category

Bayes Factors via Savage-Dickey Supermodels [IMA]

Posted in Bad Statistics, The Universe and Stuff on September 12, 2016 by telescoper

How could I possibly resist reblogging an arXiver post about “Savage-Dickey Supermodels”?

arxiver's avatararXiver

http://arxiv.org/abs/1609.02186

We outline a new method to compute the Bayes Factor for model selection which bypasses the Bayesian Evidence. Our method combines multiple models into a single, nested, Supermodel using one or more hyperparameters. Since the models are now nested the Bayes Factors between the models can be efficiently computed using the Savage-Dickey Density Ratio (SDDR). In this way model selection becomes a problem of parameter estimation. We consider two ways of constructing the supermodel in detail: one based on combined models, and a second based on combined likelihoods. We report on these two approaches for a Gaussian linear model for which the Bayesian evidence can be calculated analytically and a toy nonlinear problem. Unlike the combined model approach, where a standard Monte Carlo Markov Chain (MCMC) struggles, the combined-likelihood approach fares much better in providing a reliable estimate of the log-Bayes Factor. This scheme potentially opens the way to…

View original post 53 more words

Rank Nonsense

Posted in Bad Statistics, Education, Politics with tags , , , , , on September 8, 2016 by telescoper

It’s that time of year when international league tables (also known as “World Rankings”)  appear. We’ve already had the QS World University Rankings and the Shanghai (ARWU) World University Rankings. These will soon be joined by the Times Higher World Rankings, due out on 21st September.

A lot of people who should know a lot better give these league tables far too much attention. As far as I’m concerned they are all constructed using extremely suspect methodologies whose main function is to amplify small statistical variations into something that looks significant enough to justify constructing  a narrative about it. The resulting press coverage usually better reflects a preconceived idea in a journalist’s head than any sensible reading of the tables themselves.

A particularly egregious example of this kind of nonsense can be found in this week’s Guardian. The offending article is entitled “UK universities tumble in world rankings amid Brexit concerns”. Now I make no secret of the fact that I voted “Remain” and that I do think BrExit (if it actually happens) will damage UK universities (as well as everything else in the UK). However, linking the changes in the QS rankings to BrExit is evidently ridiculous: all the data were collected before the referendum on 23rd June anyway! In my opinion there are enough good arguments against BrExit without trying to concoct daft ones.

In any case these tables do not come with any estimate of the likely statistical variation from year to year in the metrics used to construct them, which makes changes impossible to interpret. If only the compilers of these tables would put error bars on the results! Interestingly, my former employer, the University of Sussex, has held its place exactly in the QS rankings between 2015 and 2016: it was ranked 187th in the world in both years. However, the actual score corresponding to these two years was 55.6 in 2015 and 48.4 in 2016. Moreover, Cambridge University fell from 3rd to 4th place this year but its score only changed from 98.6 to 97.2. I very much doubt that is significant at all, but it’s mentioned prominently in the subheading of the Guardian piece:

Uncertainty over research funding and immigration rules blamed for decline, as Cambridge slips out of top three for first time.

Actually, looking closer, I find that Cambridge was joint 3rd in 2015 and is 4th this year. Over-interpretation, or what?

To end with, I can’t resist mentioning that the University of Sussex is in the top 150 in the Shanghai Rankings for Natural and Mathematical Sciences this year, having not been in the top 200 last year. This stunning improvement happened while I was Head of School for Mathematical and Physical Sciences so it clearly can not be any kind of statistical fluke but is entirely attributable to excellent leadership. Thank you for your applause.


The Rising Stars of Sussex Physics

Posted in Bad Statistics, Biographical, Education with tags , , , , on July 28, 2016 by telescoper

This is my penultimate day in the office in the School of Mathematical and Physical Sciences at the University of Sussex, and a bit of news has arrived that seems a nice way to round off my stint as Head of School.

It seems that Physics & Astronomy research at the University of Sussex has been ranked as 13th in western Europe and 7th in the UK by leading academic publishers, Nature Research, and has been profiled as one of its top-25 “rising stars” worldwide.

I was tempted to describe this rise as ‘meteoric’ but in my experience meteors generally fall down rather than rise up.

Anyway, as regular readers of this blog will know, I’m generally very sceptical of the value of league tables and there’s no reason to treat this one as qualitatively any different. Here is an explanation of the (rather curious) methodology from the University of Sussex news item:

The Nature Index 2016 Rising Stars supplement identifies the countries and institutions showing the most significant growth in high-quality research publications, using the Nature Index, which tracks the research of more than 8,000 global institutions – described as “players to watch”.

The top 100 most improved institutions in the index between 2012 and 2015 are ranked by the increase in their contribution to 68 high-quality journals. From this top 100, the supplement profiles 25 rising stars – one of which is Sussex – that are already making their mark, and have the potential to shine in coming decades.

The institutions and countries examined have increased their contribution to a selection of top natural science journals — a metric known as weighted fractional count (WFC) — from 2012 to 2015.

Mainly thanks to a quadrupling of its physical sciences score, Sussex reached 351 in the Global 500 in 2015. That represents an 83.9% rise in its contribution to index papers since 2012 — the biggest jump of any UK research organisation in the top 100 most improved institutions.

It’s certainly a strange choice of metric, as it only involves publications in “high quality” journals, presumably selected by Journal Impact Factor or some other arbitrary statistical abominatio,  then taking the difference in this measure between 2012 and 2015  and expressing the change as a percentage. I noticed one institution in the list has improved by over 4600%, which makes Sussex’s change of 83.9% seem rather insignificant…

But at least this table provides some sort of evidence that the investment made in Physics & Astronomy over the last few years has made a significant (and positive) difference. The number of research faculty in Physics & Astronomy has increased by more than 60%  since 2012 so one would have been surprised not to have seen an increase in publication output over the same period. On the other hand, it seems likely that many of the high-impact papers published since 2012 were written by researchers who arrived well before then because Physics research is often a slow burner. The full impact of the most recent investments has probably not yet been felt. I’m therefore confident that Physics at Sussex has a very exciting future in store as its rising stars look set to rise still further! It’s nice to be going out on a high note!


The 3.5 keV “Line” that (probably) wasn’t…

Posted in Bad Statistics, The Universe and Stuff with tags , , , , , , , on July 26, 2016 by telescoper

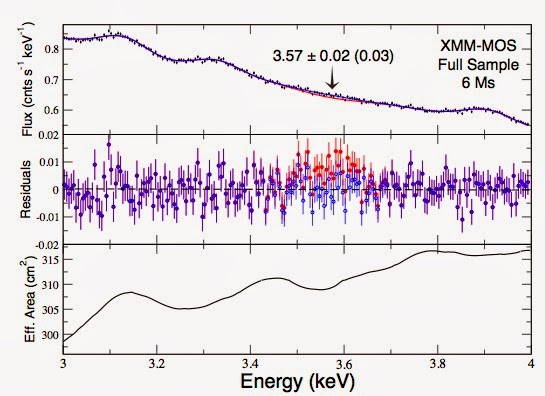
About a year ago I wrote a blog post about a mysterious “line” in the X-ray spectra of galaxy clusters corresponding to an energy of around 3.5 keV. The primary reference for the claim is a paper by Bulbul et al which is, of course, freely available on the arXiv.

The key graph from that paper is this:

XMMspectrum

The claimed feature – it stretches the imagination considerably to call it a “line” – is shown in red. No, I’m not particularly impressed either, but this is what passes for high-quality data in X-ray astronomy!

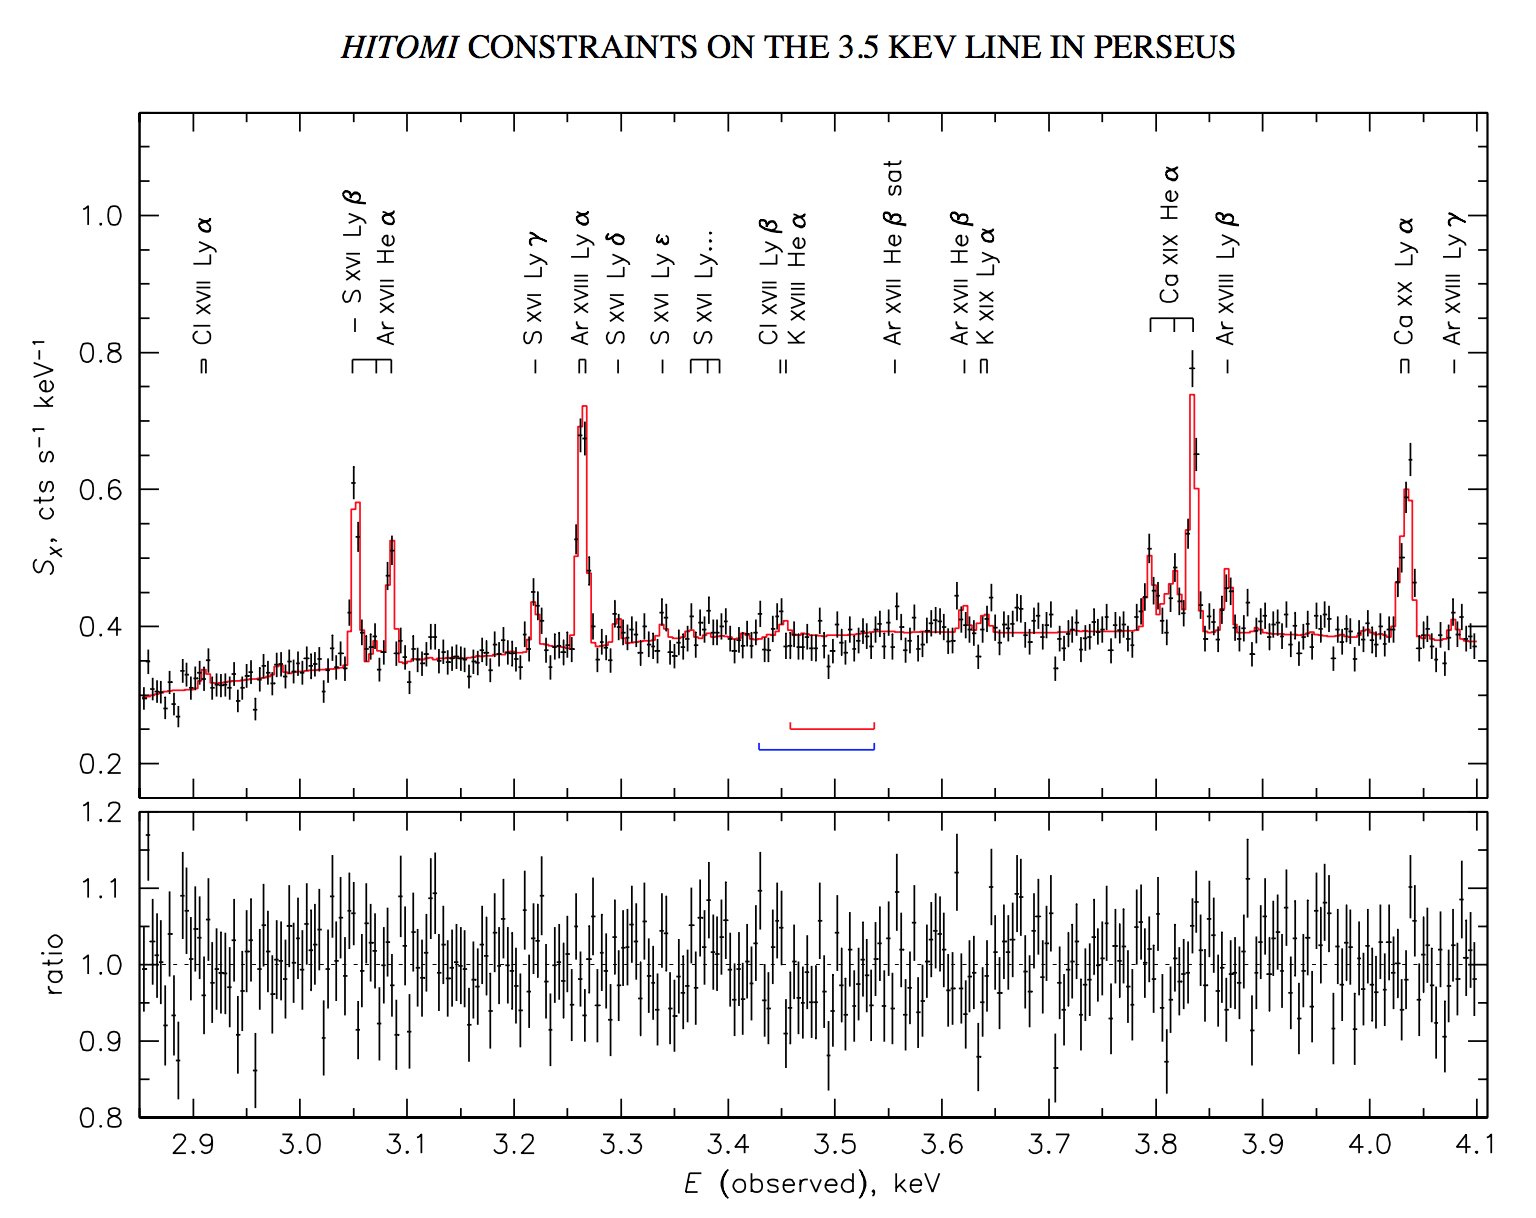
Anyway, there has just appeared on the arXiv a paper by the Hitomi Collaboration describing what are basically the only set of science results that the Hitomi satellite managed to obtain before it fell to bits earlier this year. These were observations of the Perseus Cluster.

Here is the abstract:

High-resolution X-ray spectroscopy with Hitomi was expected to resolve the origin of the faint unidentified E=3.5 keV emission line reported in several low-resolution studies of various massive systems, such as galaxies and clusters, including the Perseus cluster. We have analyzed the Hitomi first-light observation of the Perseus cluster. The emission line expected for Perseus based on the XMM-Newton signal from the large cluster sample under the dark matter decay scenario is too faint to be detectable in the Hitomi data. However, the previously reported 3.5 keV flux from Perseus was anomalously high compared to the sample-based prediction. We find no unidentified line at the reported flux level. The high flux derived with XMM MOS for the Perseus region covered by Hitomi is excluded at >3-sigma within the energy confidence interval of the most constraining previous study. If XMM measurement uncertainties for this region are included, the inconsistency with Hitomi is at a 99% significance for a broad dark-matter line and at 99.7% for a narrow line from the gas. We do find a hint of a broad excess near the energies of high-n transitions of Sxvi (E=3.44 keV rest-frame) – a possible signature of charge exchange in the molecular nebula and one of the proposed explanations for the 3.5 keV line. While its energy is consistent with XMM pn detections, it is unlikely to explain the MOS signal. A confirmation of this interesting feature has to wait for a more sensitive observation with a future calorimeter experiment.

And here is the killer plot:

Perseus_Hitomi

The spectrum looks amazingly detailed, which makes the demise of Hitomi all the more tragic, but the 3.5 keV is conspicuous by its absence. So there you are, yet another supposedly significant feature that excited a huge amount of interest turns out to be nothing of the sort. To be fair, as the abstract states, the anomalous line was only seen by stacking spectra of different clusters and might still be there but too faint to be seen in an individual cluster spectrum. Nevertheless I’d say the probability of there being any feature at 3.5 keV has decreased significantly after this observation.

P.S. rumours suggest that the 750 GeV diphoton “excess” found at the Large Hadron Collider may be about to meet a similar fate.

The Distribution of Cauchy

Posted in Bad Statistics, The Universe and Stuff with tags , , , , , on April 6, 2016 by telescoper

Back into the swing of teaching after a short break, I have been doing some lectures this week about complex analysis to theoretical physics students. The name of a brilliant French mathematician called Augustin Louis Cauchy (1789-1857) crops up very regularly in this branch of mathematics, e.g. in the Cauchy integral formula and the Cauchy-Riemann conditions, which reminded me of some old jottings aI made about the Cauchy distribution, which I never used in the publication to which they related, so I thought I’d just quickly pop the main idea on here in the hope that some amongst you might find it interesting and/or amusing.

What sparked this off is that the simplest cosmological models (including the particular one we now call the standard model) assume that the primordial density fluctuations we see imprinted in the pattern of temperature fluctuations in the cosmic microwave background and which we think gave rise to the large-scale structure of the Universe through the action of gravitational instability, were distributed according to Gaussian statistics (as predicted by the simplest versions of the inflationary universe theory).  Departures from Gaussianity would therefore, if found, yield important clues about physics beyond the standard model.

Cosmology isn’t the only place where Gaussian (normal) statistics apply. In fact they arise  fairly generically,  in circumstances where variation results from the linear superposition of independent influences, by virtue of the Central Limit Theorem. Thermal noise in experimental detectors is often treated as following Gaussian statistics, for example.

The Gaussian distribution has some nice properties that make it possible to place meaningful bounds on the statistical accuracy of measurements made in the presence of Gaussian fluctuations. For example, we all know that the margin of error of the determination of the mean value of a quantity from a sample of size n independent Gaussian-dsitributed varies as 1/\sqrt{n}; the larger the sample, the more accurately the global mean can be known. In the cosmological context this is basically why mapping a larger volume of space can lead, for instance, to a more accurate determination of the overall mean density of matter in the Universe.

However, although the Gaussian assumption often applies it doesn’t always apply, so if we want to think about non-Gaussian effects we have to think also about how well we can do statistical inference if we don’t have Gaussianity to rely on.

That’s why I was playing around with the peculiarities of the Cauchy distribution. This distribution comes up in a variety of real physics problems so it isn’t an artificially pathological case. Imagine you have two independent variables X and Y each of which has a Gaussian distribution with zero mean and unit variance. The ratio Z=X/Y has a probability density function of the form

p(z)=\frac{1}{\pi(1+z^2)},

which is a Cauchy distribution. There’s nothing at all wrong with this as a distribution – it’s not singular anywhere and integrates to unity as a pdf should. However, it does have a peculiar property that none of its moments is finite, not even the mean value!

Following on from this property is the fact that Cauchy-distributed quantities violate the Central Limit Theorem. If we take n independent Gaussian variables then the distribution of sum X_1+X_2 + \ldots X_n has the normal form, but this is also true (for large enough n) for the sum of n independent variables having any distribution as long as it has finite variance.

The Cauchy distribution has infinite variance so the distribution of the sum of independent Cauchy-distributed quantities Z_1+Z_2 + \ldots Z_n doesn’t tend to a Gaussian. In fact the distribution of the sum of any number of  independent Cauchy variates is itself a Cauchy distribution. Moreover the distribution of the mean of a sample of size n does not depend on n for Cauchy variates. This means that making a larger sample doesn’t reduce the margin of error on the mean value!

This was essentially the point I made in a previous post about the dangers of using standard statistical techniques – which usually involve the Gaussian assumption – to distributions of quantities formed as ratios.

We cosmologists should be grateful that we don’t seem to live in a Universe whose fluctuations are governed by Cauchy, rather than (nearly) Gaussian, statistics. Measuring more of the Universe wouldn’t be any use in determining its global properties as we’d always be dominated by cosmic variance

The Insignificance of ORB

Posted in Bad Statistics with tags , , , on April 5, 2016 by telescoper

A piece about opinion polls ahead of the EU Referendum which appeared in today’s Daily Torygraph has spurred me on to make a quick contribution to my bad statistics folder.

The piece concerned includes the following statement:

David Cameron’s campaign to warn voters about the dangers of leaving the European Union is beginning to win the argument ahead of the referendum, a new Telegraph poll has found.

The exclusive poll found that the “Remain” campaign now has a narrow lead after trailing last month, in a sign that Downing Street’s tactic – which has been described as “Project Fear” by its critics – is working.

The piece goes on to explain

The poll finds that 51 per cent of voters now support Remain – an increase of 4 per cent from last month. Leave’s support has decreased five points to 44 per cent.

This conclusion is based on the results of a survey by ORB in which the number of participants was 800. Yes, eight hundred.

How much can we trust this result on statistical grounds?

Suppose the fraction of the population having the intention to vote in a particular way in the EU referendum is p. For a sample of size n with x respondents indicating that they hen one can straightforwardly estimate p \simeq x/n. So far so good, as long as there is no bias induced by the form of the question asked nor in the selection of the sample which, given the fact that such polls have been all over the place seems rather unlikely.

A little bit of mathematics involving the binomial distribution yields an answer for the uncertainty in this estimate of p in terms of the sampling error:

\sigma = \sqrt{\frac{p(1-p)}{n}}

For the sample size of 800 given, and an actual value p \simeq 0.5 this amounts to a standard error of about 2%. About 95% of samples drawn from a population in which the true fraction is p will yield an estimate within p \pm 2\sigma, i.e. within about 4% of the true figure. In other words the typical variation between two samples drawn from the same underlying population is about 4%. In other other words, the change reported between the two ORB polls mentioned above can be entirely explained by sampling variation and does not at all imply any systematic change of public opinion between the two surveys.
I need hardly point out that in a two-horse race (between “Remain” and “Leave”) an increase of 4% in the Remain vote corresponds to a decrease in the Leave vote by the same 4% so a 50-50 population vote can easily generate a margin as large as  54-46 in such a small sample.

Why do pollsters bother with such tiny samples? With such a large margin error they are basically meaningless.

I object to the characterization of the Remain campaign as “Project Fear” in any case. I think it’s entirely sensible to point out the serious risks that an exit from the European Union would generate for the UK in loss of trade, science funding, financial instability, and indeed the near-inevitable secession of Scotland. But in any case this poll doesn’t indicate that anything is succeeding in changing anything other than statistical noise.

Statistical illiteracy is as widespread amongst politicians as it is amongst journalists, but the fact that silly reports like this are commonplace doesn’t make them any less annoying. After all, the idea of sampling uncertainty isn’t all that difficult to understand. Is it?

And with so many more important things going on in the world that deserve better press coverage than they are getting, why does a “quality” newspaper waste its valuable column inches on this sort of twaddle?

More fine structure silliness …

Posted in Bad Statistics, The Universe and Stuff with tags , on March 17, 2016 by telescoper

Wondering what had happened to claims of a spatial variation of the fine-structure constant?

Well, they’re still around but there’s still very little convincing evidence to support them, as this post explains…

A Bump at the Large Hadron Collider

Posted in Bad Statistics, The Universe and Stuff with tags , , , on December 16, 2015 by telescoper

Very busy, so just a quickie today. Yesterday the good folk at the Large Hadron Collider announced their latest batch of results. You can find the complete set from the CMS experiment here and from ATLAS here.

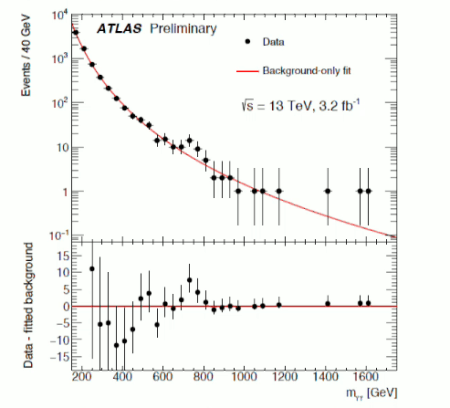
The result that everyone is talking about is shown in the following graph, which shows the number of diphoton events as a function of energy:

Atlas_Bump

Attention is focussing on the apparent “bump” at around 750 GeV; you can find an expert summary by a proper particle physicist here and another one here.

It is claimed that the “significance level” of this “detection” is 3.6σ. I won’t comment on that precise statement partly because it depends on the background signal being well understood but mainly because I don’t think this is the right language in which to express such a result in the first place. Experimental particle physicists do seem to be averse to doing proper Bayesian analyses of their data.

However if you take the claim in the way such things are usually presented it is roughly equivalent to a statement that the odds against this being a real detection are greater that 6000:1. If any particle physicists out there are willing to wager £6000 for £1 of mine that this result will be confirmed by future measurements then I’d happily take them up on that bet!

P.S. Entirely predictably there are 10 theory papers on today’s ArXiv offering explanations of the alleged bump, none of which says that it’s a noise feature..


Gamma-Ray Bursts and the Cosmological Principle

Posted in Astrohype, Bad Statistics, The Universe and Stuff with tags , , , on September 13, 2015 by telescoper

There’s been a reasonable degree of hype surrounding a paper published in Monthly Notices of the Royal Astronomical Society (and available on the arXiv here). The abstract of this paper reads:

According to the cosmological principle (CP), Universal large-scale structure is homogeneous and isotropic. The observable Universe, however, shows complex structures even on very large scales. The recent discoveries of structures significantly exceeding the transition scale of 370 Mpc pose a challenge to the CP. We report here the discovery of the largest regular formation in the observable Universe; a ring with a diameter of 1720 Mpc, displayed by 9 gamma-ray bursts (GRBs), exceeding by a factor of 5 the transition scale to the homogeneous and isotropic distribution. The ring has a major diameter of 43° and a minor diameter of 30° at a distance of 2770 Mpc in the 0.78 < z < 0.86 redshift range, with a probability of 2 × 10⁻⁶ of being the result of a random fluctuation in the GRB count rate. Evidence suggests that this feature is the projection of a shell on to the plane of the sky. Voids and string-like formations are common outcomes of large-scale structure. However, these structures have maximum sizes of 150 Mpc, which are an order of magnitude smaller than the observed GRB ring diameter. Evidence in support of the shell interpretation requires that temporal information of the transient GRBs be included in the analysis. This ring-shaped feature is large enough to contradict the CP. The physical mechanism responsible for causing it is unknown.

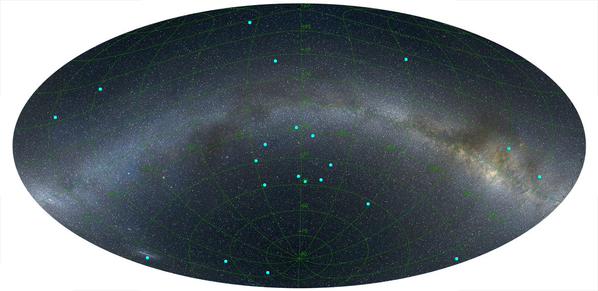
The so-called “ring” can be seen here:
ring_Australia

In my opinion it’s not a ring at all, but an outline of Australia. What’s the probability of a random distribution of dots looking exactly like that? Is it really evidence for the violation of the Cosmological Principle, or for the existence of the Cosmic Antipodes?

For those of you who don’t get that gag, a cosmic antipode occurs in, e.g., closed Friedmann cosmologies in which the spatial sections take the form of a hypersphere (or 3-sphere). The antipode is the point diametrically opposite the observer on this hypersurface, just as it is for the surface of a 2-sphere such as the Earth. The antipode is only visible if it lies inside the observer’s horizon, a possibility which is ruled out for standard cosmologies by current observations. I’ll get my coat.

Anyway, joking apart, the claims in the abstract of the paper are extremely strong but the statistical arguments supporting them are deeply unconvincing. Indeed, I am quite surprised the paper passed peer review. For a start there’s a basic problem of “a posteriori” reasoning here. We see a group of objects that form a map of Australia ring and then are surprised that such a structure appears so rarely in simulations of our favourite model. But all specific configurations of points are rare in a Poisson point process. We would be surprised to see a group of dots in the shape of a pretzel too, or the face of Jesus, but that doesn’t mean that such an occurrence has any significance. It’s an extraordinarily difficult problem to put a meaningful measure on the space of geometrical configurations, and this paper doesn’t succeed in doing that.

For a further discussion of the tendency that people have to see patterns where none exist, take a look at this old post from which I’ve taken this figure which is generated by drawing points independently and uniformly randomly:

pointaI can see all kinds of shapes in this pattern, but none of them has any significance (other than psychological). In a mathematically well-defined sense there is no structure in this pattern! Add to that difficulty the fact that so few points are involved and I think it becomes very clear that this “structure” doesn’t provide any evidence at all for the violation of the Cosmological Principle. Indeed it seems neither do the authors. The very last paragraph of the paper is as follows:

GRBs are very rare events superimposed on the cosmic
web identified by superclusters. Because of this, the ring is
probably not a real physical structure. Further studies are
needed to reveal whether or not the Ring could have been
produced by a low-frequency spatial harmonic of the large-
scale matter density distribution and/or of universal star
forming activity.

It’s a pity that this note of realism didn’t make it into either the abstract or, more importantly, the accompanying press release. Peer review will never be perfect, but we can do without this sort of hype. Anyway, I confidently predict that a proper refutation will appear shortly….

P.S. For a more technical discussion of the problems of inferring the presence of large structures from sparsely-sampled distributions, see here.

Adventures with the One-Point Distribution Function

Posted in Bad Statistics, Books, Talks and Reviews, Talks and Reviews, The Universe and Stuff with tags , , on September 1, 2015 by telescoper

As I promised a few people, here are the slides I used for my talk earlier today at the meeting I am attending. Actually I was given only 30 minutes and used up a lot of that time on two things that haven’t got much to do with the title. One was a quiz to identify the six famous astronomers (or physicists) who had made important contributions to statistics (Slide 2) and the other was on some issues that arose during the discussion session yesterday evening. I didn’t in the end talk much about the topic given in the title, which was about how, despite learning a huge amount about certain aspects of galaxy clustering, we are still far from a good understanding of the one-point distribution of density fluctuations. I guess I’ll get the chance to talk more about that in the near future!

P.S. I think the six famous faces should be easy to identify, so there are no prizes but please feel free to guess through the comments box!