As before, entries to the Research Image Competition were divided into two Themes: Theme 1 (Particle and Nuclear Physics) and Theme 2 (Astronomy, Cosmology and Solar & Planetary Science) and scores were allocated by the judges based on visual impact and scientific interest. Once again, the standard was very high, but there were clear winners in each category. Here they are:
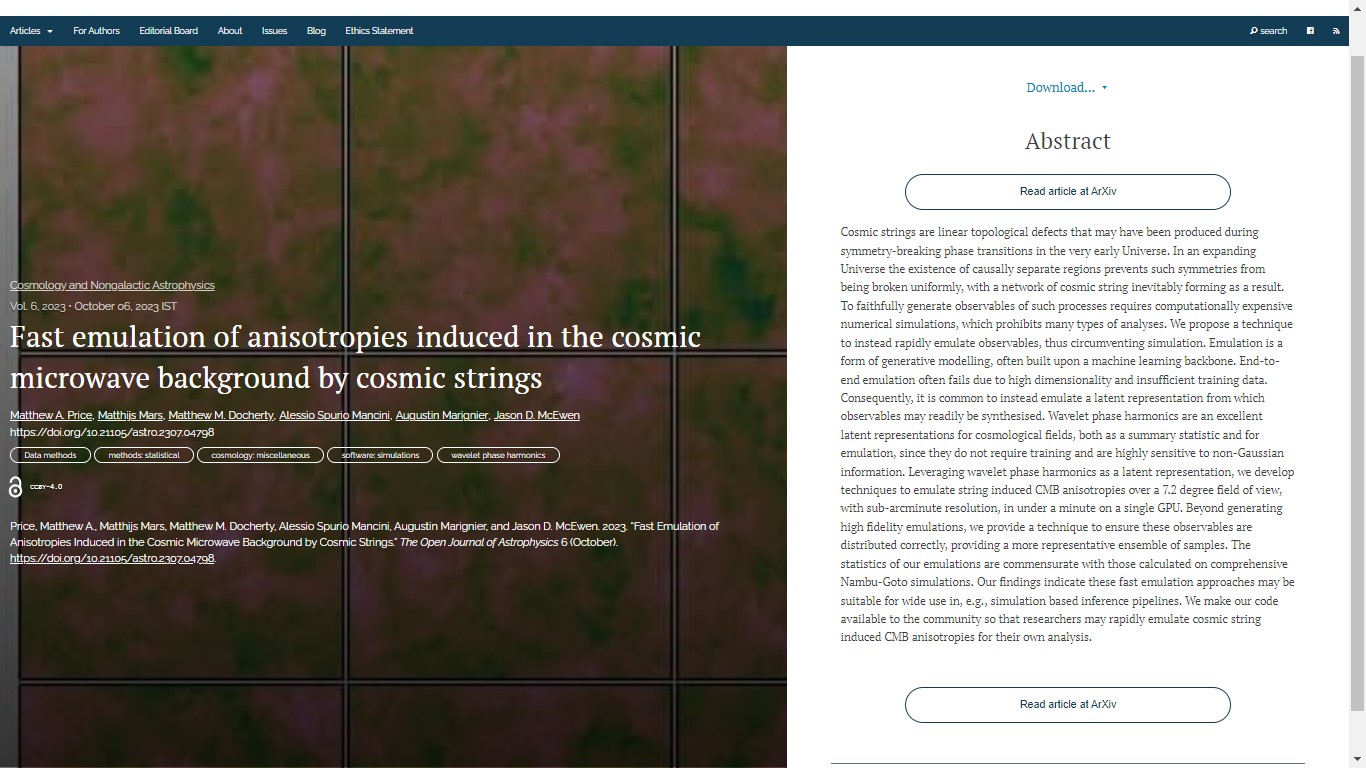
LUCA REALI, MAX BOLEININGER, DANIEL MASON, SERGEI DUDAREV (UKAEA)
DATA INTENSIVE CAMBRIDGE
Molecular dynamics simulations of high-dose radiation damage in tungsten to understand the evolution of the material under fusion reactor conditions. Blue spheres are vacancies (missing-atom defects), orange spheres are interstitials (extra-atom defects). Lines are dislocations (linear crystallographic defect).
Softwares: LAMMPS for simulations, Ovito for the rendering.
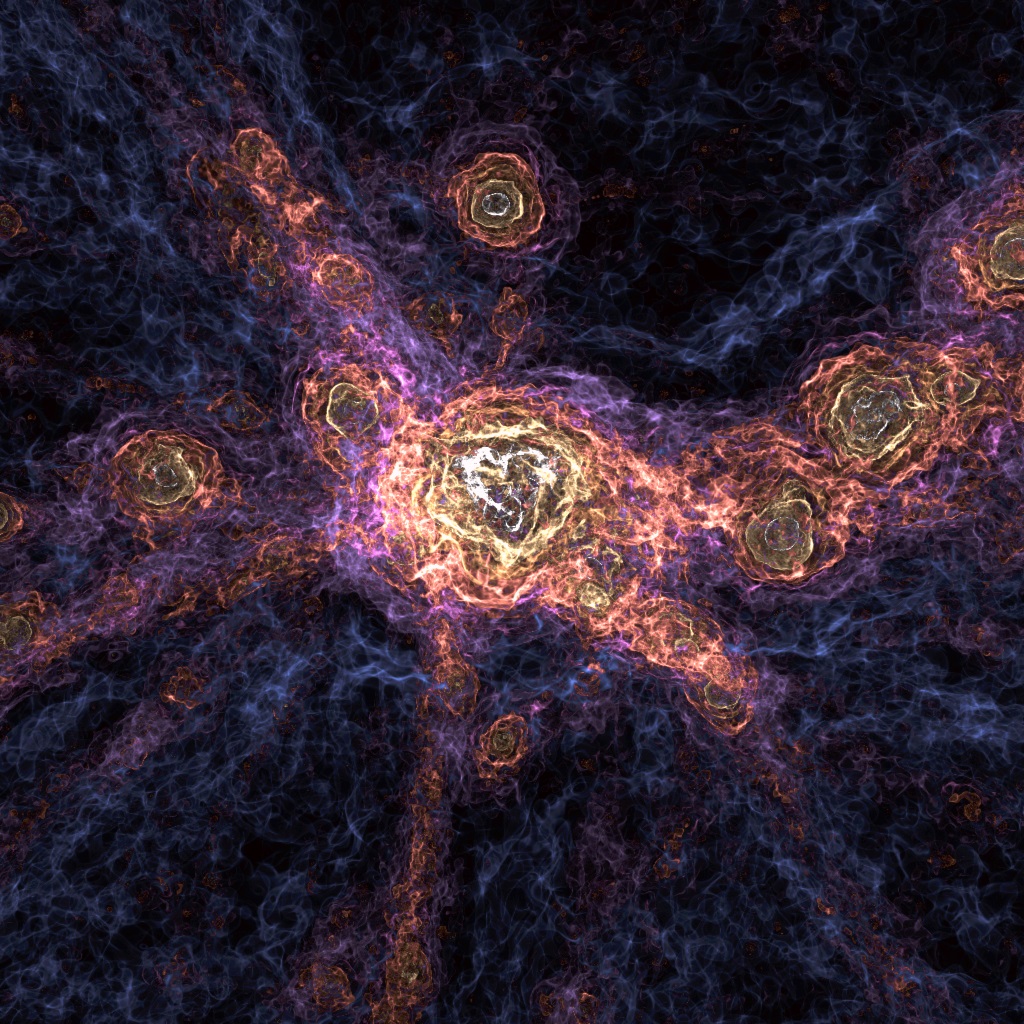
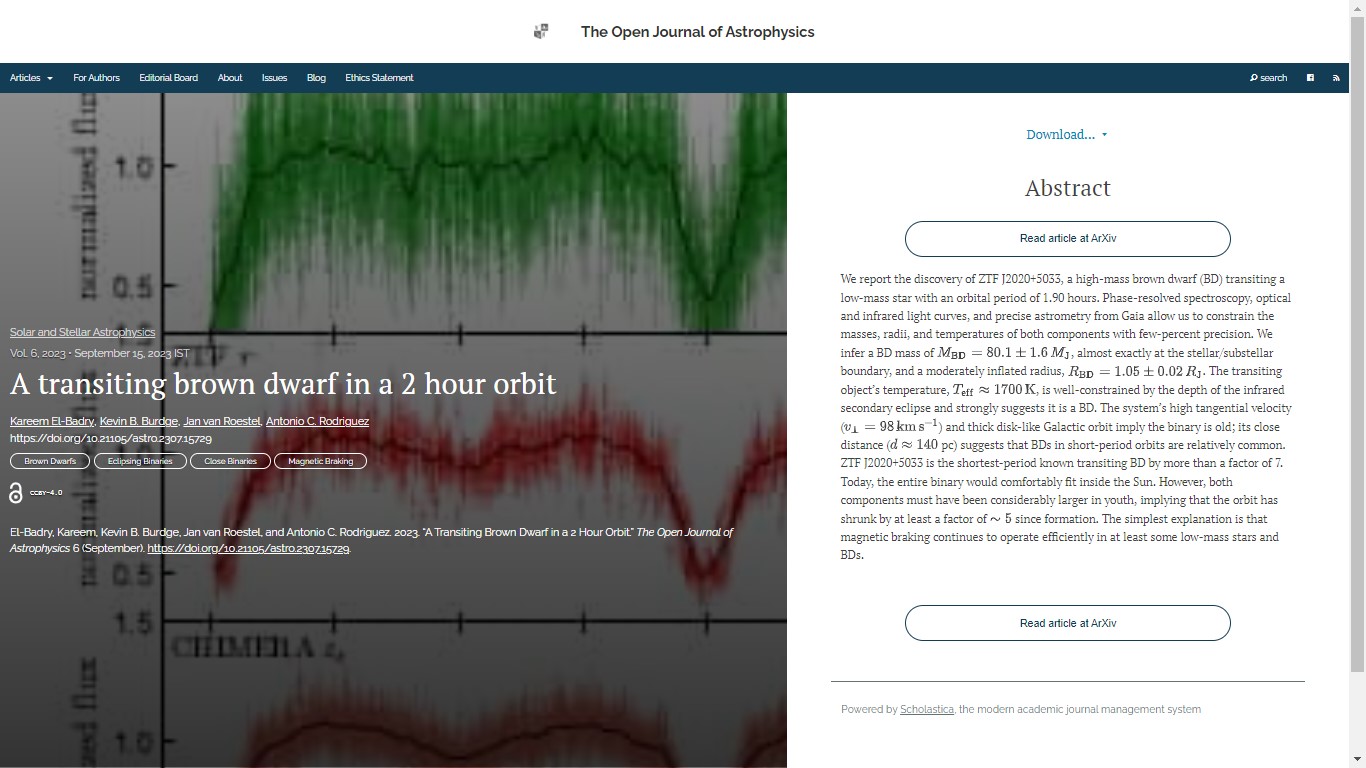
JOSH BORROW, FLAMINGO TEAM
MEMORY INTENSIVE DURHAM
The most massive galaxy cluster in the flagship, 2.8 Gpc, FLAMINGO volume, with each side of the image spanning 40 megaparsecs. Each colour represents a different gas density contour, highlighting the extremely complex spatial and velocity structure of the gas within the cluster. At the center, the gas serendipitously aligns to produce a love heart.
The image was created with DiRAC supported software SWIFT and swiftsimio.
For more details about these images and the other entries see here. The 2024 Dirac Calendar features a selection of the entries.
Congratulations to the winners and indeed all the entrants!
At the annual AAS Meeting in New Orleans last week there was an announcement of a result that made headlines in the media (see, e.g., here and here). There is also a press release from the University of Central Lancashire.
Here is a video of the press conference:
I was busy last week so didn’t have time to read the details so refrained from commenting on this issue at the time of the announcement. Now that I am back in circulation, I have time to read the details, but unfortunately was unable to find even a preprint describing this “discovery”. The press conference doesn’t contain much detail either so it’s impossible to say anything much about the significance of the result, which is claimed (without explanation) to be 5.2σ (after “doing some statistics”). I see the “Big Ring” now has its own wikipedia page, the only references on which are to press reports, not peer-reviewed scientific papers or even preprints.
So is this structure “so big it challenges our understanding of the universe”?
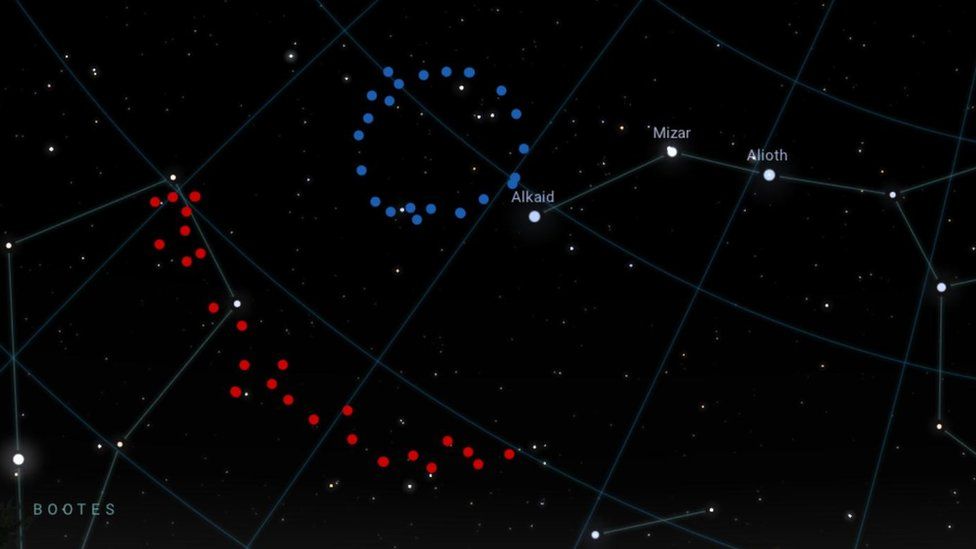
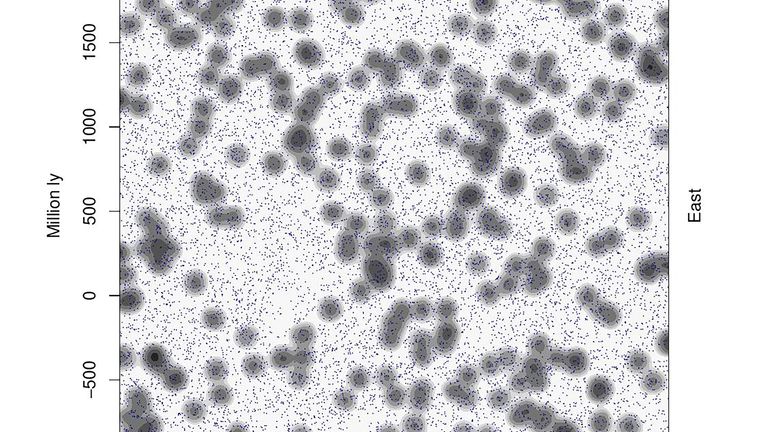
The Big Ring (blue) and another large structure (red)Spot the Ring in the actual data
Based on the available information it is impossible to say. The large-scale structure of the Universe comprises a complex network of walls and filaments known as the cosmic web which I have written about numerous times on this blog. This structure is so vast and complicated that it is very easy to find strange shapes in it but very hard to determine whether or not they indicate anything other than an over-active imagination.
To assess the significance of the Big Ring or other structures in a proper scientific fashion, one has to calculate how probable that structure is given a model. We have a standard model that can be used for this purpose, but to simulate very structures is not straightforward because it requires a lot of computing power even to simulate just the mass distribution. In this case one also has to understand how to embed Magnesium absorption too, something which may turn out to trace the mass in a very biased way. Moreover, one has to simulate the observational selection process too, so one is doing a fair comparison between observations and predictions.
I have seen no evidence that this has been done in this case. When it is, I’ll comment on the details. I’m not optimistic however, as the description given in the media accounts contains numerous falsehoods. For example, quoting the lead author:
The Cosmological Principle assumes that the part of the universe we can see is viewed as a ‘fair sample’ of what we expect the rest of the universe to be like. We expect matter to be evenly distributed everywhere in space when we view the universe on a large scale, so there should be no noticeable irregularities above a certain size.
This just isn’t correct. The standard cosmology has fluctuations on all scales. Although the fluctuation amplitude decreases with scale, there is no scale at which the Universe is completely smooth. See the discussion, for example, here. We can see correlations on very large angular scales in the cosmic microwave background which would be absent if the Universe were completely smooth on those scales. The observed structure is about 400 Mpc in size, which does not seem to be to be particularly impressive.
I suspect that the 5.2σ figure mentioned above comes from some sort of comparison between the observed structure and a completely uniform background, in which case it is meaningless.
My main comment on this episode is that I think it’s very poor practice to go hunting headlines when there isn’t even a preprint describing the results. That’s not the sort of thing PhD supervisors should be allowing their PhD students to do. As I have mentioned before on this blog, there is an increasing tendency for university press offices to see themselves entirely as marketing agencies instead of informing and/or educating the public. Press releases about scientific research nowadays rarely make any attempt at accuracy – they are just designed to get the institution concerned into the headlines. In other words, research is just a marketing tool.
In the long run, this kind of media circus, driven by hype rather than science, does nobody any good.
P.S. I was going to joke that ring-like structures can be easily explained by circular reasoning, but decided not to.
Well, it’s 2024 and time to start a new volume – the seventh – of the Open Journal of Astrophysics with the very first paper of the new year. The paper in question is the 1st paper in Volume 7 (2024) and the 116th altogether. This one was published on 8th January 2024.
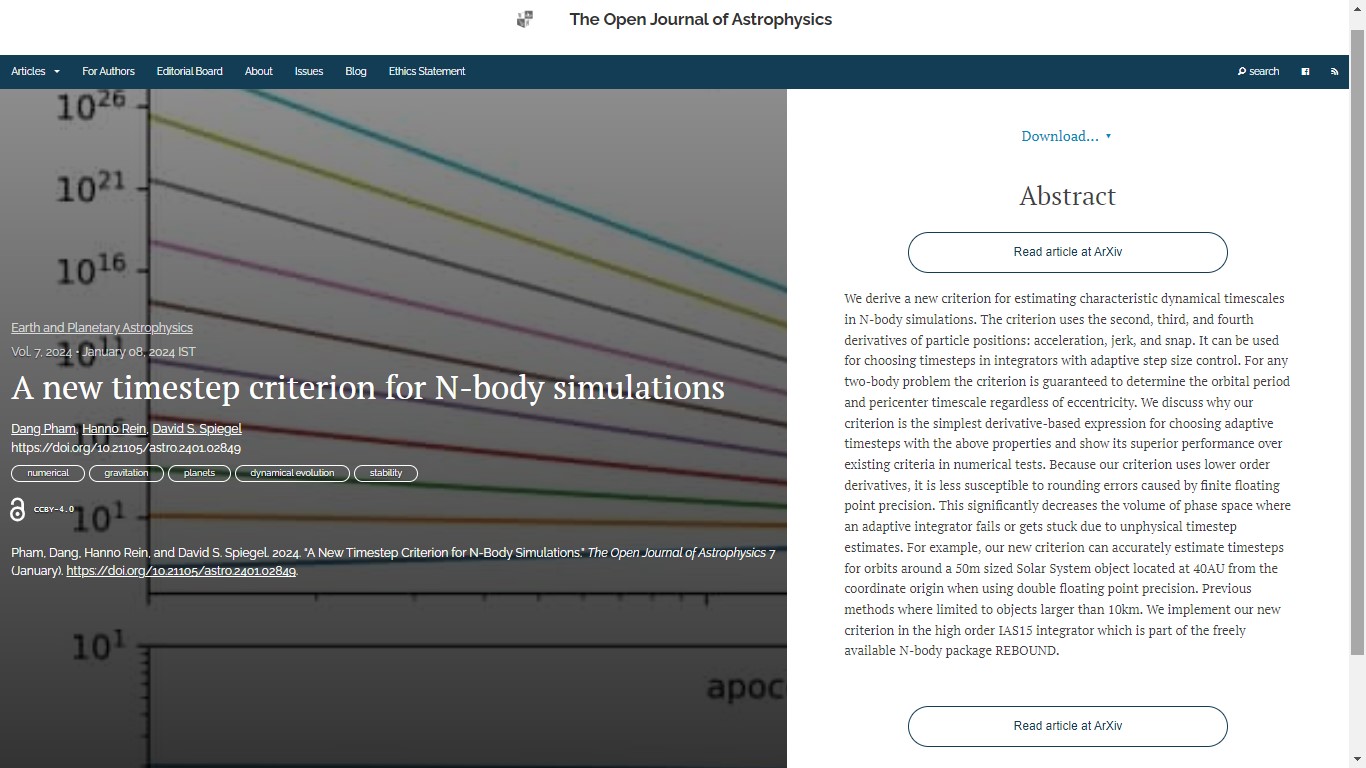
The title is “A new timestep criterion for N-body simulations” and it presents a new method for estimating characteristic dynamical timescales in N-body simulations, based on derivatives up to fourth order, which can be used to adjust timesteps used in numerical computations. The paper is in the folder marked Earth and Planetary Astrophysics as the paper discusses applications to orbital dynamics in planetary systems, but the method is of much wider applicability.
The authors are Dang Pham & Hanno Rein (University of Toronto, Canada) and David S. Spiegel (Google, USA).
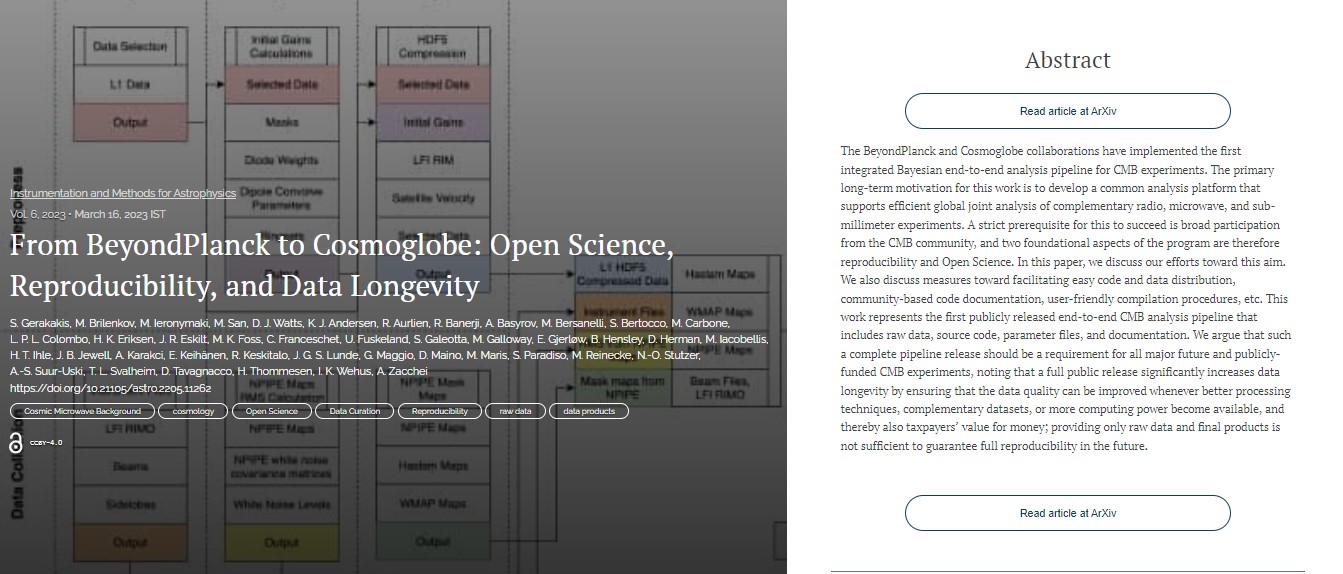
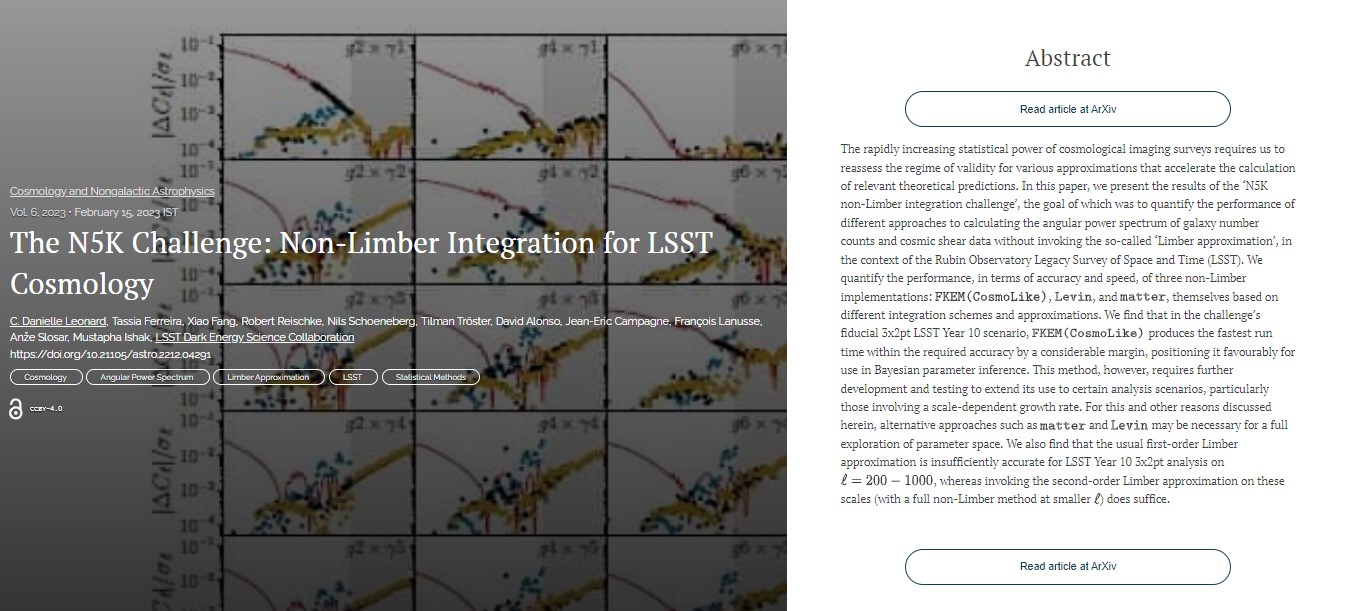
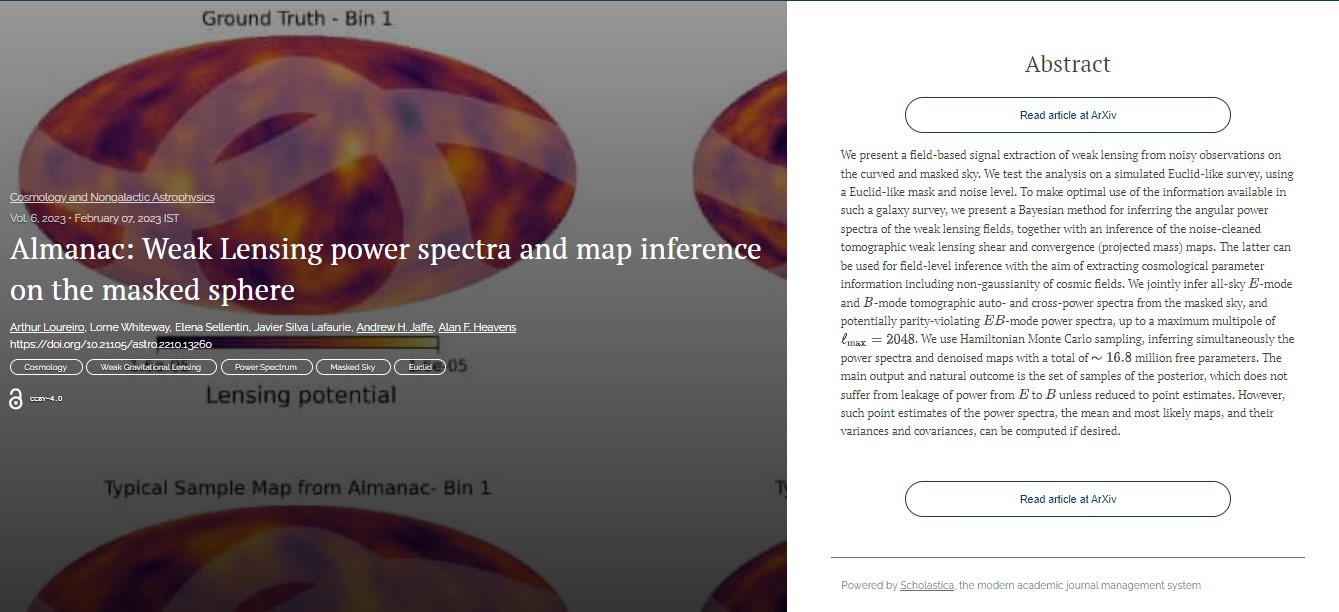
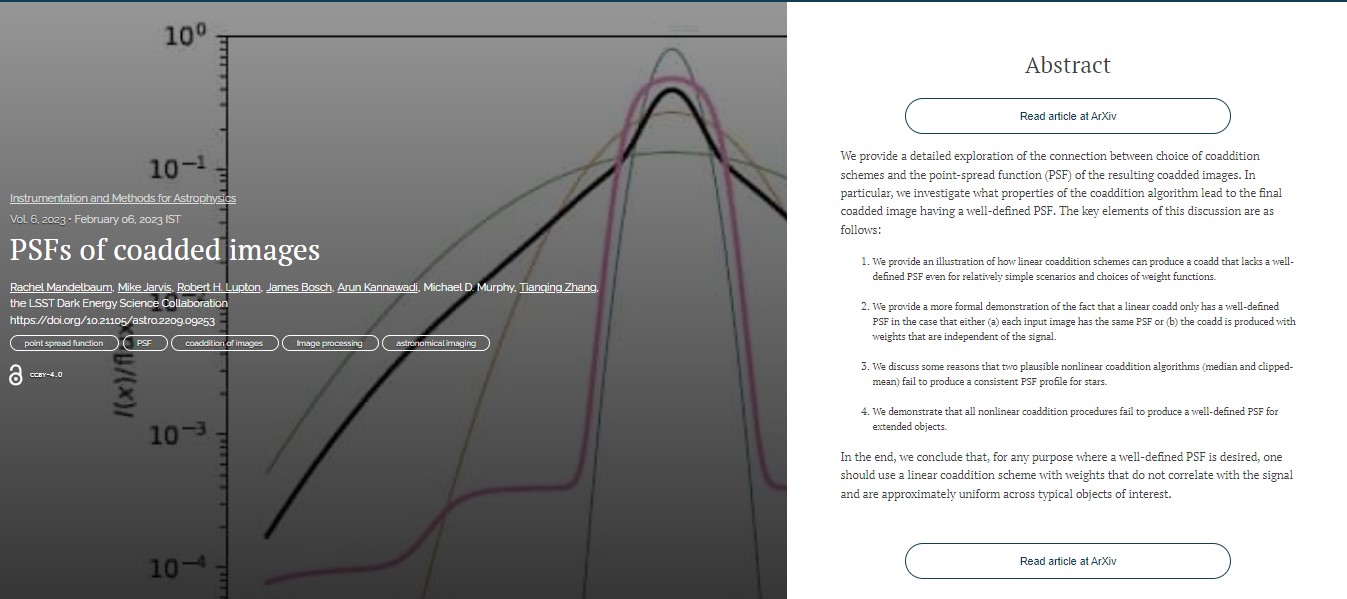
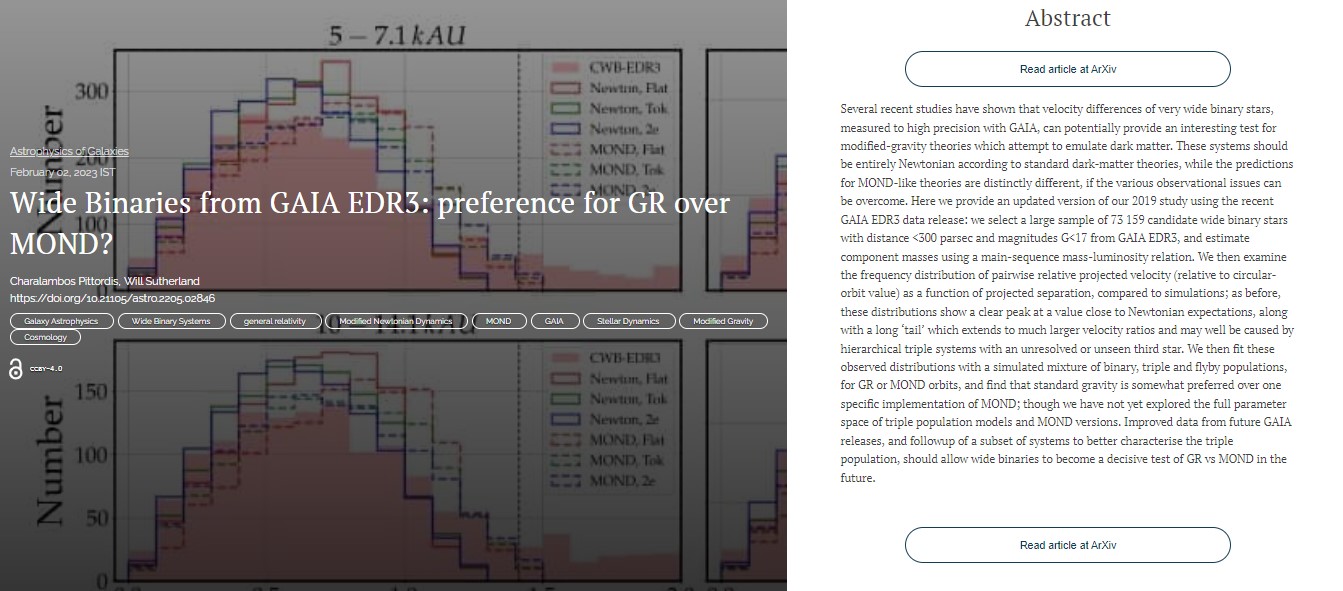
Here is the overlay of the paper containing the abstract:
You can click on the image of the overlay to make it larger should you wish to do so. You can find the officially accepted version of the paper on the arXiv here.
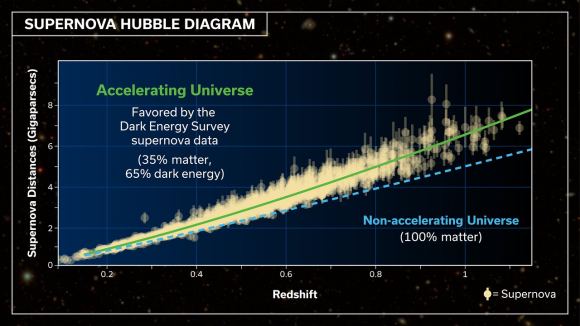
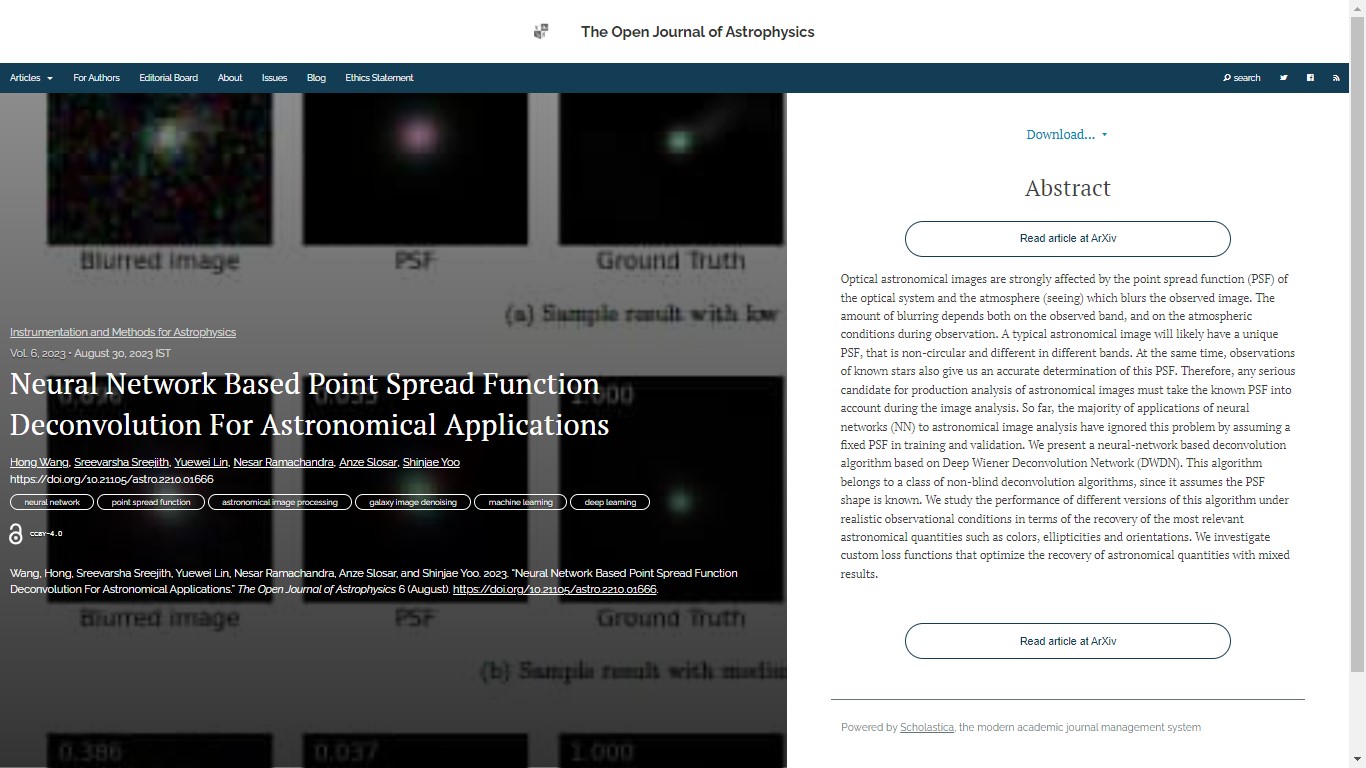
Some important cosmological results have just been announced by the Dark Energy Survey Collaboration. I haven’t had time to go through them in detail but I thought it was worth doing a quick post here to draw attention to them. The results concern a sample of Type Ia supernovae (SN Ia) discovered during the full five years of the Dark Energy Survey (DES) Supernova Program, which contains about 1500 new Type Ia Supernovae that can be used for cosmological analysis. The paper is available on the arXiv here; the abstract is:
The key numerical result of interest is the equation-of-state parameter for dark energy, designated by w, which occurs in the (assumed) relationship between pressure p and effective mass density ρ of the form p=wρc2. A cosmological constant – which for many cosmologists is the default assumption for the form of dark energy – has w=-1 as I explained here. This parameter is one of the things Euclid is going to try to measure, using different methods. Interestingly, the DES results are offset a bit from the value of -1, but with quite a large uncertainty.
While the results for the equation-of-state parameter are somewhat equivocal, one thing that is clear is that the new SNIa measurements do confirm the existence of dark energy, in that the data can only be described by models with accelerating expansion, as dramatically demonstrated in this Figure:
I think this figure – or versions of it – will very rapidly appear in public talks on cosmology, including my own!
Earth’s elliptical orbit viewed at an angle (which makes it look more eccentric than it is – in reality is very nearly circular).
I haven’t received a Royal Astronomical Society diary this year, which I’m sad about as it has been a bit of a tradition, as well as being a useful source of astronomical information. According to other sources, however, today (Wednesday 3rd January 2024) at approximately 00.39 GMT the Earth reached the point on its orbit closest to the Sun, i.e. its perihelion. At this time the distance from the Sun’s centre to Earth’s centre was 147,100,632 km. This year, aphelion (the furthest distance from the Sun) is at 06.06 GMT on July 6th 2023 at which point the centre of the Earth will be 152,099,968 km from the centre of the Sun. You can find a list of times and dates of perihelion and aphelion for future years here.
It surprises me how many people think that the existence of the seasons has something to do with the variation of the Earth’s distance from the Sun as it moves in its orbit in that the closer to the Sun we get the warmer the weather will be. The fact that perihelion occurs in the depth of winter should convince anyone living in the Northern hemisphere that this just can’t be the case, as should the fact that it’s summer in the Southern hemisphere while it is winter in the North.
The real reason for the existence of seasons is the tilt of the Earth’s axis of rotation. I used to do a little demonstration with a torch (flashlight to American readers) to illustrate this when I taught first-year astrophysics. If you shine a torch horizontally at a piece of card it will illuminate a patch of the card. Keep the torch at the same distance but tilt the card and you will see the illuminated patch increase in size. The torch is radiating the same amount of energy but in the second case that energy is spread over a larger area than in the first. This means that the energy per unit area incident on the card is decreases when the card is tilted. It is that which is responsible for winter being colder than summer. In the summer the sun is higher in the sky (on average) than in winter. From this argument you can infer that the winter solstice not the perihelion, is the relevant astronomical indicator of winter.
That is not to say that the shape of the Earth’s orbit has no effect on temperatures. It may, for example, contribute to the summer in the Southern hemisphere being hotter than in the North, although it is not the only effect. The Earth’s surface possesses a significant North-South asymmetry: there is a much larger fraction of ocean in the Southern hemisphere, for example, which could be responsible for moderating any differences in temperature due to insolation. The climate is a non-linear system that involves circulating air and ocean currents that respond in complicated ways and on different timescales not just to insolation but to many other parameters, including atmospheric composition (especially the amount of water vapour).
The dates when Earth reaches the extreme points on its orbit (apsides) are not fixed because of the variations in its orbital eccentricity so, in the short-term, the dates can vary up to 2 days from one year to another. The perihelion distance varies slightly from year to year too; it’s slightly larger this year than last year, for example.
There is however a long-term trend for perihelion to occur later in the year. For example, in 1246, the December Solstice (winter solstice for the Northern Hemisphere) was on the same day as the Earth’s perihelion. Since then, the perihelion and aphelion dates have drifted by an average of one day every 58 years and this trend will continue. This means that by the year 6430 the timing of the perihelion and the March Equinox will coincide, although I hope to have retired by then…
It’s New Year’s Eve and I just remembered that there was a paper at the Open Journal of Astrophysics site that we published before Christmas but that I haven’t yet announced on here, so for the sake of completeness here it is. It takes us to 50 papers published in 2023.
The paper in question is the 50th and final paper in Volume 6 (2023) and it’s the 115th altogether. This one was actually published on Friday 22nd December 2023 but owing to the vacations we had to wait a bit to get the metadata registered.
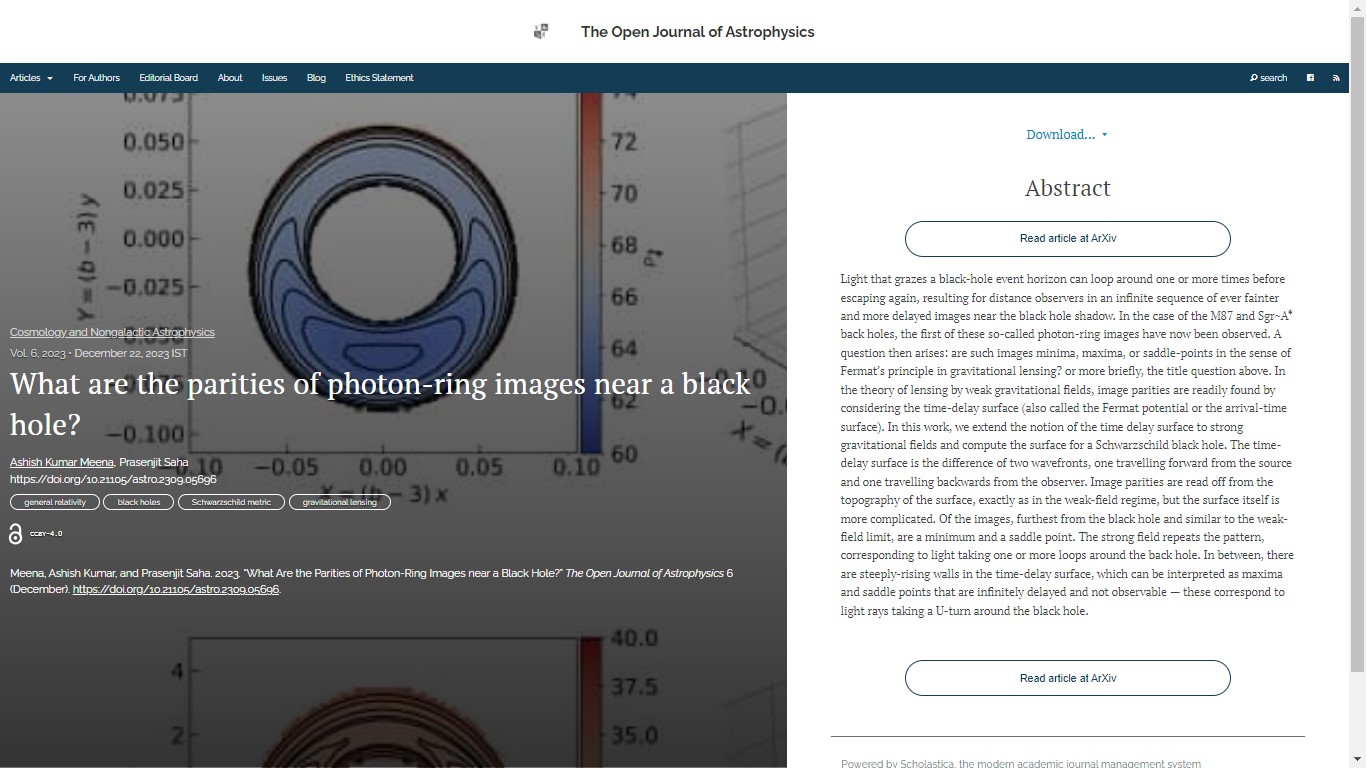
The title of this one is “What are the parities of photon-ring images near a black hole?” and is a discussion of the Fermat potential (also known as the arrival-time surface) in the context of gravitational lensing by strong gravitational fields and the implication for image parities thereby produced. This one is actually listed in General Relativity and Quantum Cosmology (gr-qc, on arXiv) but is cross-listed as Cosmology and Non-galactic Astrophysics so is eligible for publication here in the appropriate folder.
The authors are Ashish Kumar Meena (Ben Gurion University of the Negev, Israel) and Prasenjit Saha (University of Zurich, Switzerland).
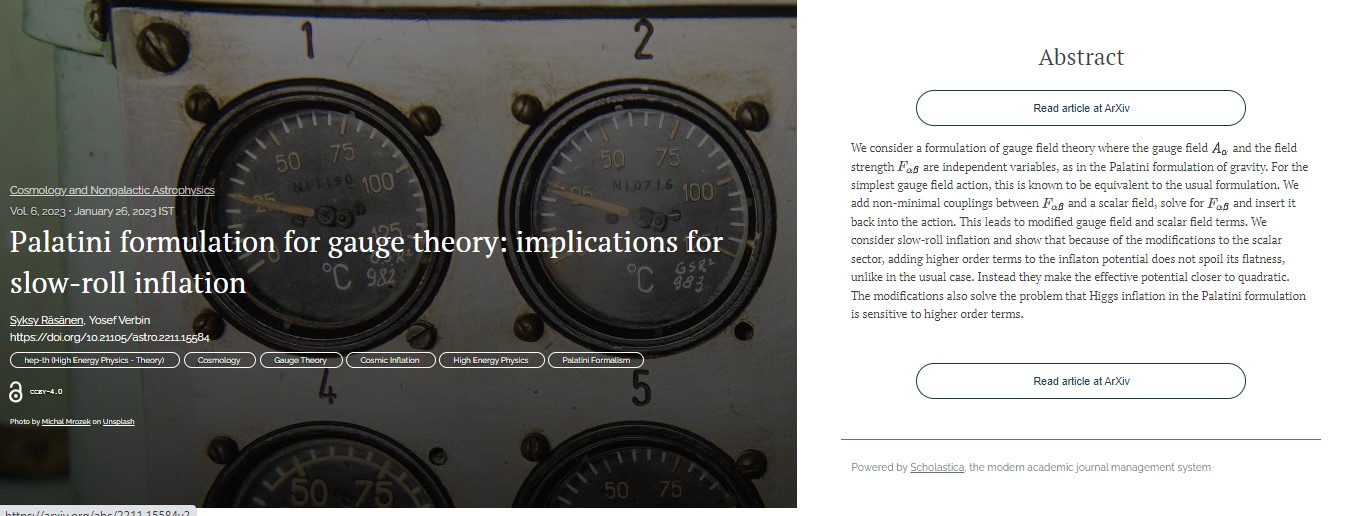
Here is the overlay of the paper containing the abstract:
You can click on the image of the overlay to make it larger should you wish to do so. You can find the officially accepted version of the paper on the arXiv here.
And that concludes Volume 6 of the Open Journal of Astrophysics. Roll on Volume 7.
I was leafing through my copy of the 2023 Private Eye Annual and thought it would be fun to do a sort of annual for the Open Journal of Astrophysics, so here you are: all 50 of the papers in Volume 6 (2023) in glorious technicolour.
I could have linked each image to the relevant paper, but I’m way to lazy to do that!
In case you are interested here is the breakdown into different sections:
You can see that over half the papers we published are in Cosmology and Nongalactic Astrophysics, and just three arXiv categories account for 90% of the publications. I hope we can increase our diversity in 2024!
I’m very sorry, especially just before Christmas, to pass on the news of the death of Russian physicist and cosmologist Alexei Starobinsky who died yesterday (21st December 2023) of complications resulting from Covid-19. I heard this morning, but have been travelling all day and only just found time to write something in appreciation.
Starobinsky was one of the many academic descendants of the great Zeldovich; he did particularly important work on the physics of the early Universe in which field his ideas prefigured the theory that came to be known as cosmic inflation. Although Starobinsky’s seminal (1979) work on this topic was not well known outside the Soviet Union at the time Alan Guth wrote his paper on inflation (1981), it did later gained wider appreciation, and led to numerous awards, including the Gruber Prize in 2013 and the Kavli Prize in 2014 (together with Guth and Andrei Linde).
I do have one rather fond personal memory of Starobinsky, from when we were coincidentally both visiting IUCAA in Pune at the same time back in the Nineties. We ended up going on a shopping trip together during which he revealed himself to be hopeless at the kind of light-hearted haggling that was the norm in the places we visited. He ended up paying way over the odds for everything he bought. He didn’t seem to mind though, and apparently found it all quite amusing. I only met him a few times and didn’t get to know him well at all, but he struck me as a very nice man as well as a fine physicist of the old-school Russian type.
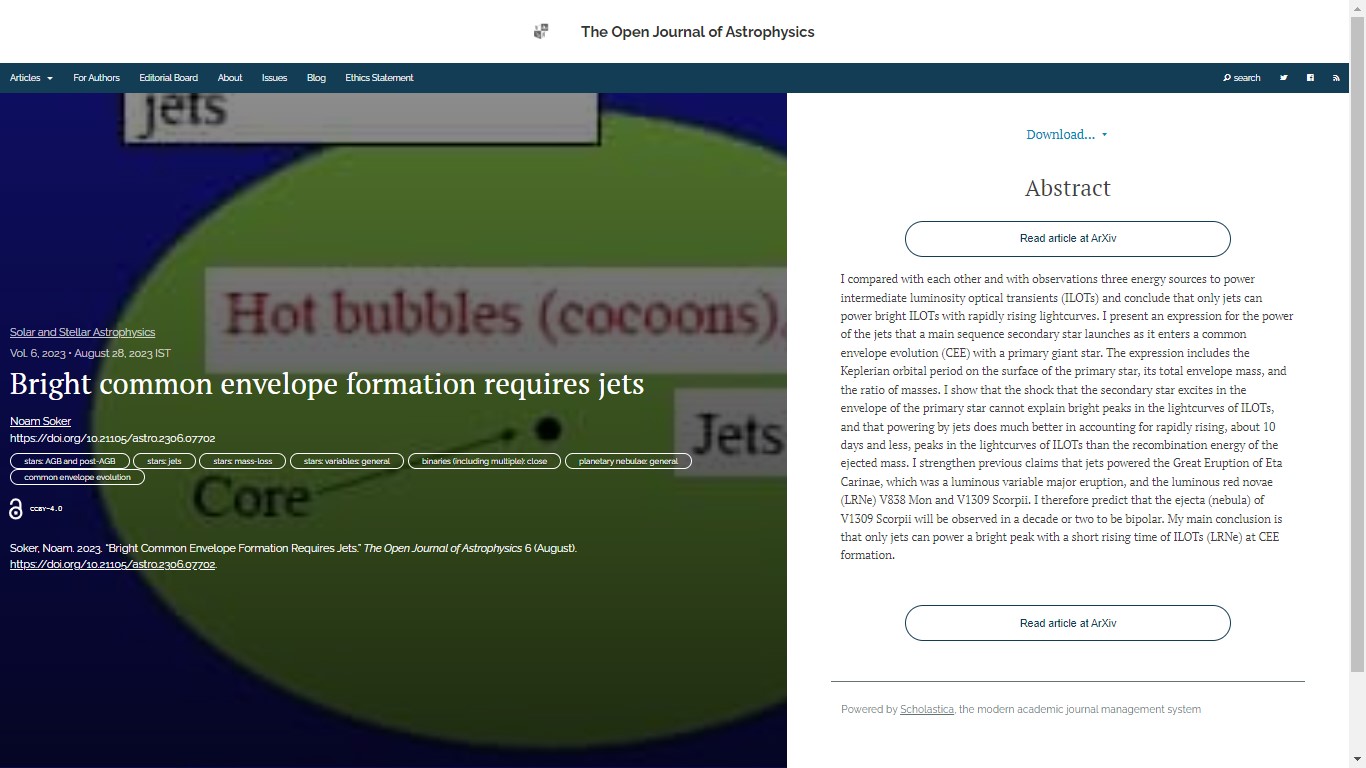
Sunlight at dawn on the Winter Solstice at Newgrange
Just a quick note to point out that the Winter Solstice in the Northern hemisphere happens tomorrow, Friday 22nd December 2023, at 4.27 am CET (3.27 UT). I am posting this in advance as although I am will be getting up quite early to catch a flight, it won’t be that early…
People often think that the Winter Solstice is defined to be the “shortest day” or the “longest night” of the year. The Solstice is actually defined in astronomical terms much more precisely than that. It happens when the axial tilt of the Earth away from the Sun is greatest, so that the Sun appears in the sky with its lowest maximum elevation. The timing of this event can be calculated with great precision.
In Barcelona, sunrise today (21st December) is at 8.13 am and sunset at 5.24 pm, while tomorrow the sunrise is at 8.14 am and sunset at 5.25 pm. The Solstice therefore occurs before sunrise tomorrow morning and the interval between sunrise and sunset tomorrow will be very close to that today; the interval between sunrise and sunset on 20th December (yesterday) was four whole seconds longer than on 22nd (today); the shortest day is therefore today rather than tomorrow. Moreover, the Solstice marks neither the latest sunrise nor the earliest sunset: sunrise will carry on getting later until the new year, the length of the day nevertheless increasing because sunset occurs even later. For a full explanation of this, see last year’s Winter Solstice post.
The views presented here are personal and not necessarily those of my employer (or anyone else for that matter).
Feel free to comment on any of the posts on this blog but comments may be moderated; anonymous comments and any considered by me to be vexatious and/or abusive and/or defamatory will not be accepted. I do not necessarily endorse, support, sanction, encourage, verify or agree with the opinions or statements of any information or other content in the comments on this site and do not in any way guarantee their accuracy or reliability.