There’s been a reasonable degree of hype surrounding a paper published in Monthly Notices of the Royal Astronomical Society (and available on the arXiv here). The abstract of this paper reads:
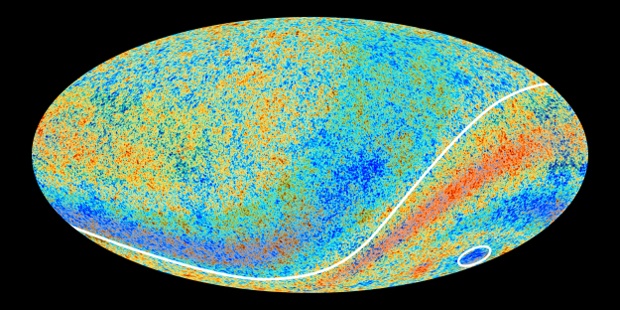
According to the cosmological principle (CP), Universal large-scale structure is homogeneous and isotropic. The observable Universe, however, shows complex structures even on very large scales. The recent discoveries of structures significantly exceeding the transition scale of 370 Mpc pose a challenge to the CP. We report here the discovery of the largest regular formation in the observable Universe; a ring with a diameter of 1720 Mpc, displayed by 9 gamma-ray bursts (GRBs), exceeding by a factor of 5 the transition scale to the homogeneous and isotropic distribution. The ring has a major diameter of 43° and a minor diameter of 30° at a distance of 2770 Mpc in the 0.78 < z < 0.86 redshift range, with a probability of 2 × 10⁻⁶ of being the result of a random fluctuation in the GRB count rate. Evidence suggests that this feature is the projection of a shell on to the plane of the sky. Voids and string-like formations are common outcomes of large-scale structure. However, these structures have maximum sizes of 150 Mpc, which are an order of magnitude smaller than the observed GRB ring diameter. Evidence in support of the shell interpretation requires that temporal information of the transient GRBs be included in the analysis. This ring-shaped feature is large enough to contradict the CP. The physical mechanism responsible for causing it is unknown.
The so-called “ring” can be seen here:
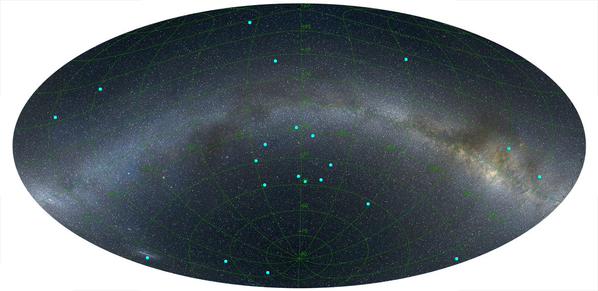
In my opinion it’s not a ring at all, but an outline of Australia. What’s the probability of a random distribution of dots looking exactly like that? Is it really evidence for the violation of the Cosmological Principle, or for the existence of the Cosmic Antipodes?
For those of you who don’t get that gag, a cosmic antipode occurs in, e.g., closed Friedmann cosmologies in which the spatial sections take the form of a hypersphere (or 3-sphere). The antipode is the point diametrically opposite the observer on this hypersurface, just as it is for the surface of a 2-sphere such as the Earth. The antipode is only visible if it lies inside the observer’s horizon, a possibility which is ruled out for standard cosmologies by current observations. I’ll get my coat.
Anyway, joking apart, the claims in the abstract of the paper are extremely strong but the statistical arguments supporting them are deeply unconvincing. Indeed, I am quite surprised the paper passed peer review. For a start there’s a basic problem of “a posteriori” reasoning here. We see a group of objects that form a map of Australia ring and then are surprised that such a structure appears so rarely in simulations of our favourite model. But all specific configurations of points are rare in a Poisson point process. We would be surprised to see a group of dots in the shape of a pretzel too, or the face of Jesus, but that doesn’t mean that such an occurrence has any significance. It’s an extraordinarily difficult problem to put a meaningful measure on the space of geometrical configurations, and this paper doesn’t succeed in doing that.
For a further discussion of the tendency that people have to see patterns where none exist, take a look at this old post from which I’ve taken this figure which is generated by drawing points independently and uniformly randomly:
 I can see all kinds of shapes in this pattern, but none of them has any significance (other than psychological). In a mathematically well-defined sense there is no structure in this pattern! Add to that difficulty the fact that so few points are involved and I think it becomes very clear that this “structure” doesn’t provide any evidence at all for the violation of the Cosmological Principle. Indeed it seems neither do the authors. The very last paragraph of the paper is as follows:
GRBs are very rare events superimposed on the cosmic
web identified by superclusters. Because of this, the ring is
probably not a real physical structure. Further studies are
needed to reveal whether or not the Ring could have been
produced by a low-frequency spatial harmonic of the large-
scale matter density distribution and/or of universal star
forming activity.
It’s a pity that this note of realism didn’t make it into either the abstract or, more importantly, the accompanying press release. Peer review will never be perfect, but we can do without this sort of hype. Anyway, I confidently predict that a proper refutation will appear shortly….
P.S. For a more technical discussion of the problems of inferring the presence of large structures from sparsely-sampled distributions, see here.
Follow @telescoper