It’s Saturday once more so time for another update of activity at the Open Journal of Astrophysics. Since the last update we have published a further six papers, bringing the number in Volume 9 (2026) to 30 and the total so far published by OJAp up to 478.
I will continue to include the posts made on our Mastodon account (on Fediscience) to encourage you to visit it. Mastodon is a really excellent service, and a more than adequate replacement for X/Twitter (which nobody should be using); these announcements also show the DOI for each paper.
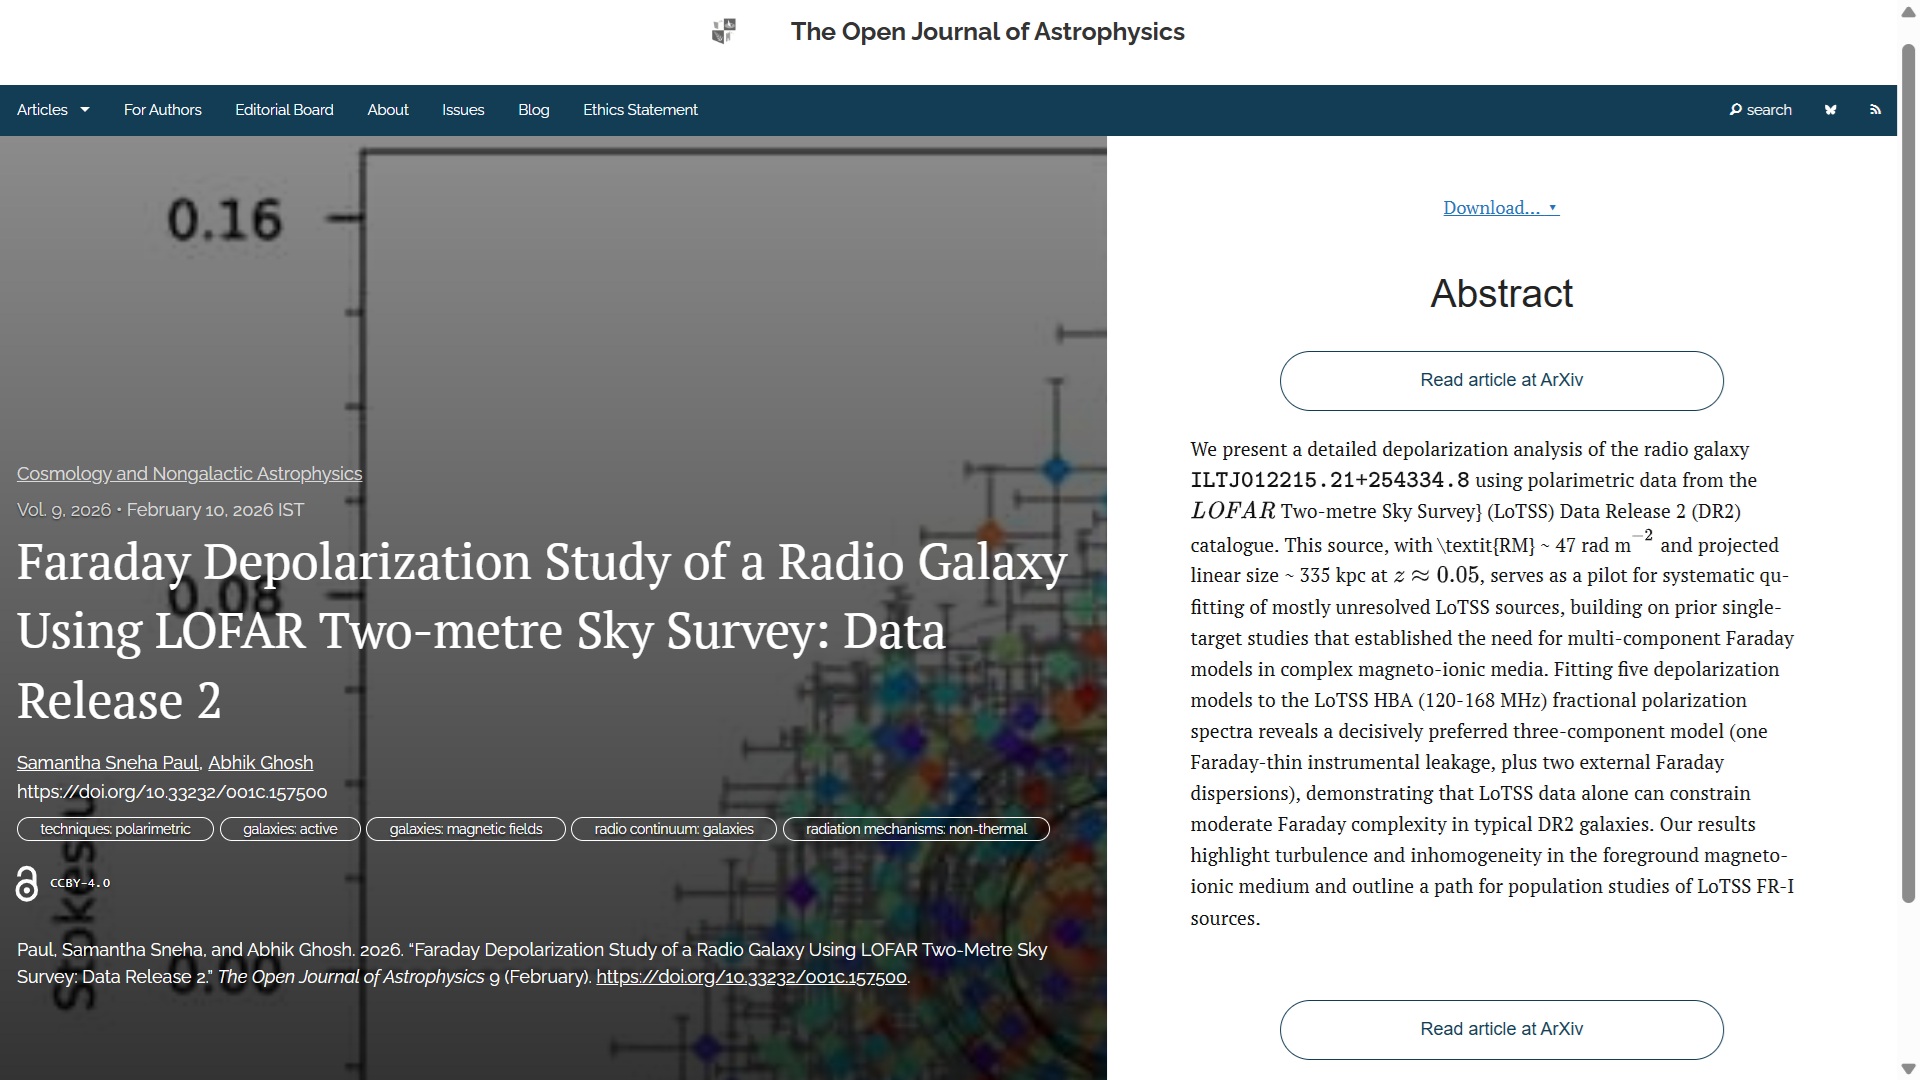
The first paper to report this week is “Faraday Depolarization Study of a Radio Galaxy Using LOFAR Two-metre Sky Survey: Data Release 2” by Samantha Sneha Paul and Abhik Ghosh (Banwarilal Bhalotia College, India). This was published on Tuesday February 10th in the folder Cosmology and Nongalactic Astrophysics. The paper analyzes the depolarization of radio galaxy ILTJ012215.21+254334.8 using LOFAR’s Sky Survey data, revealing a preferred three-component model and highlighting turbulence in the magneto-ionic medium.
The overlay is here:
You can find the officially accepted version on arXiv here and the announcement on Fediverse here:

The second paper is “Rapid cosmological inference with the two-loop matter power spectrum” by Thomas Bakx (Utrecht U., NL), Henrique Rubira (Ludwig-Maximilians-Universität, DE), Nora Elisa Chisari (Utrecht) and Zvonimir Vlah (Ruđer Bošković Institute, Croatia). This was also published on Tuesday February 10th in the folder Cosmology and Nongalactic Astrophysics. This paper uses the COBRA method to compute the two-loop effective field theory power spectrum of dark matter density fluctuations, providing more precise cosmological constraints than the one-loop EFT.
The overlay for this one is here:
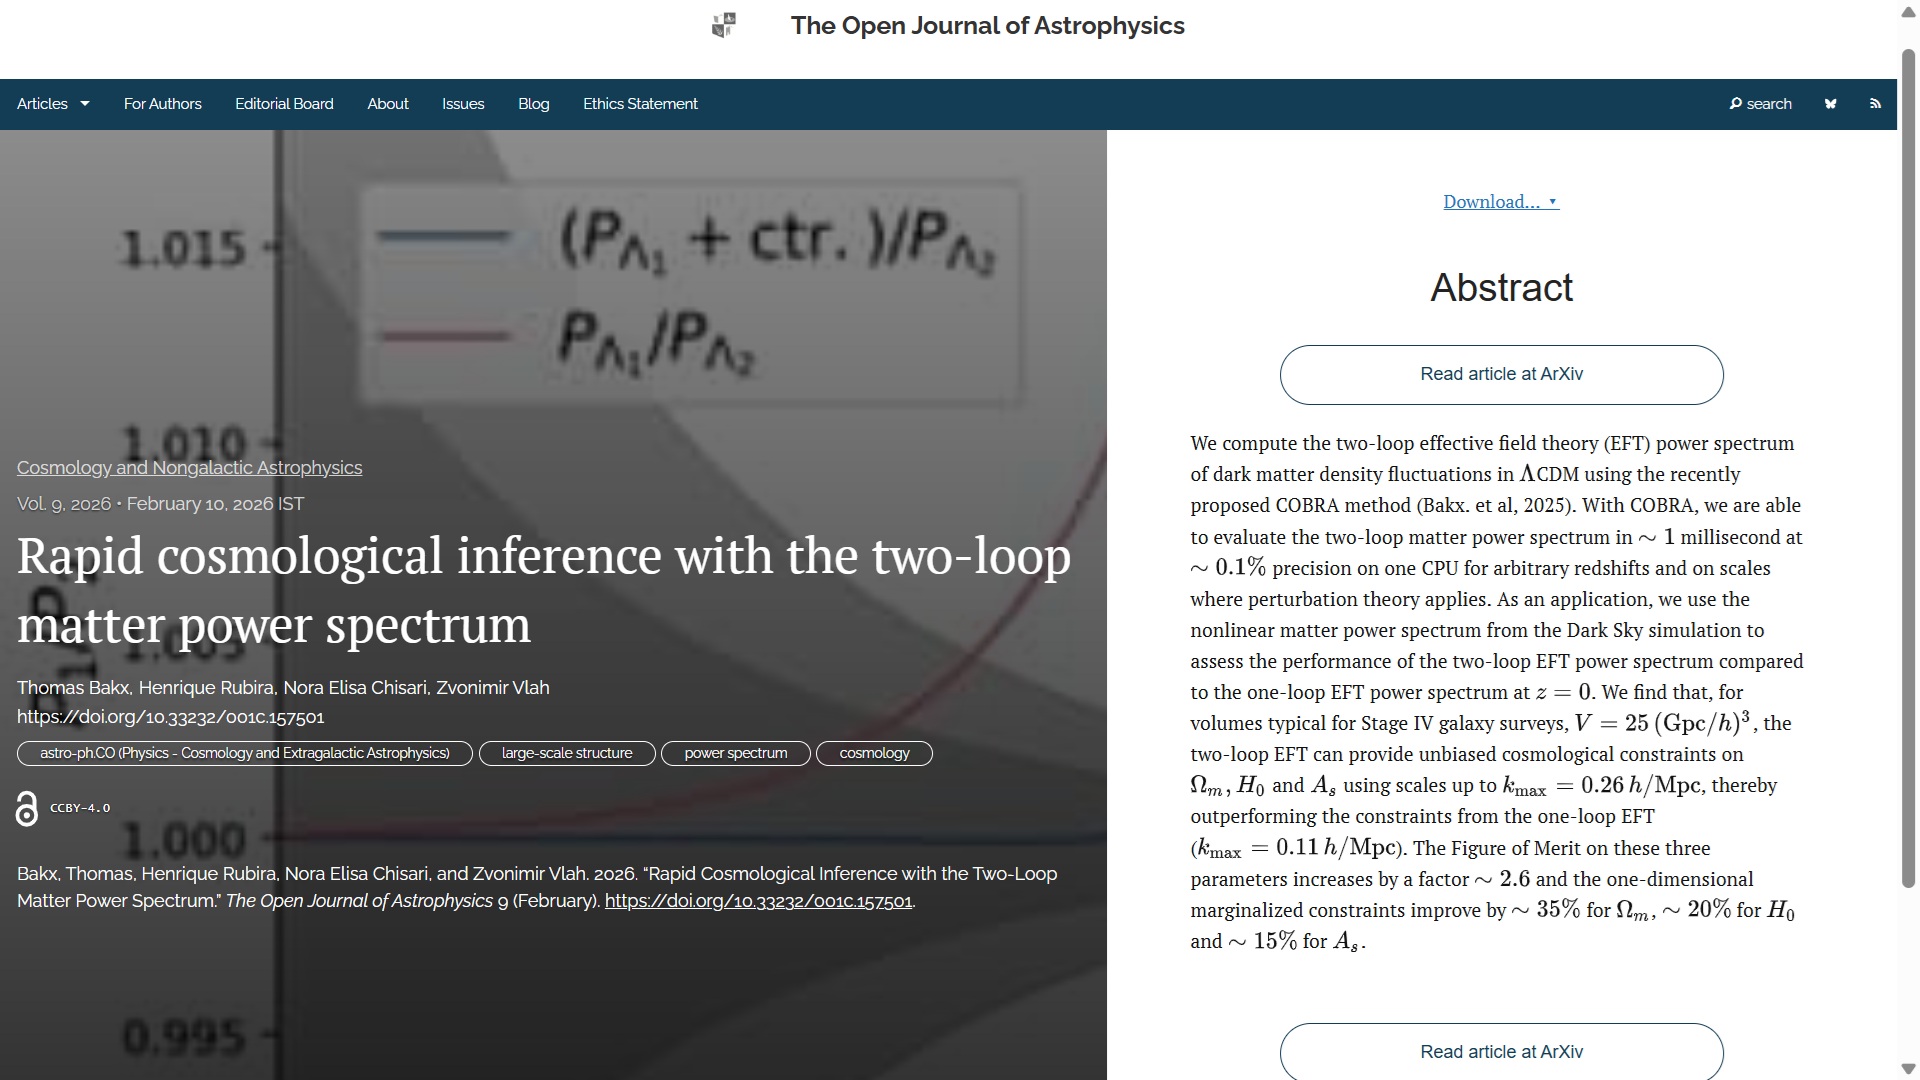
The official version of the paper can be found on arXiv here and the Fediverse announcement here:
Next, published on Wednesday 11th February in the folder Astrophysics of Galaxies, is “Interpreting nebular emission lines in the high-redshift Universe” by Aswin P. Vijayan (U. Sussex, UK) and 9 others based in the UK, Taiwan, China and The Netherlands. This article examines the reliability of diagnostics used to estimate star formation rate and gas-phase oxygen abundance in high-redshift galaxies. It finds that variations in stellar populations and star-dust geometry. The overlay is here:
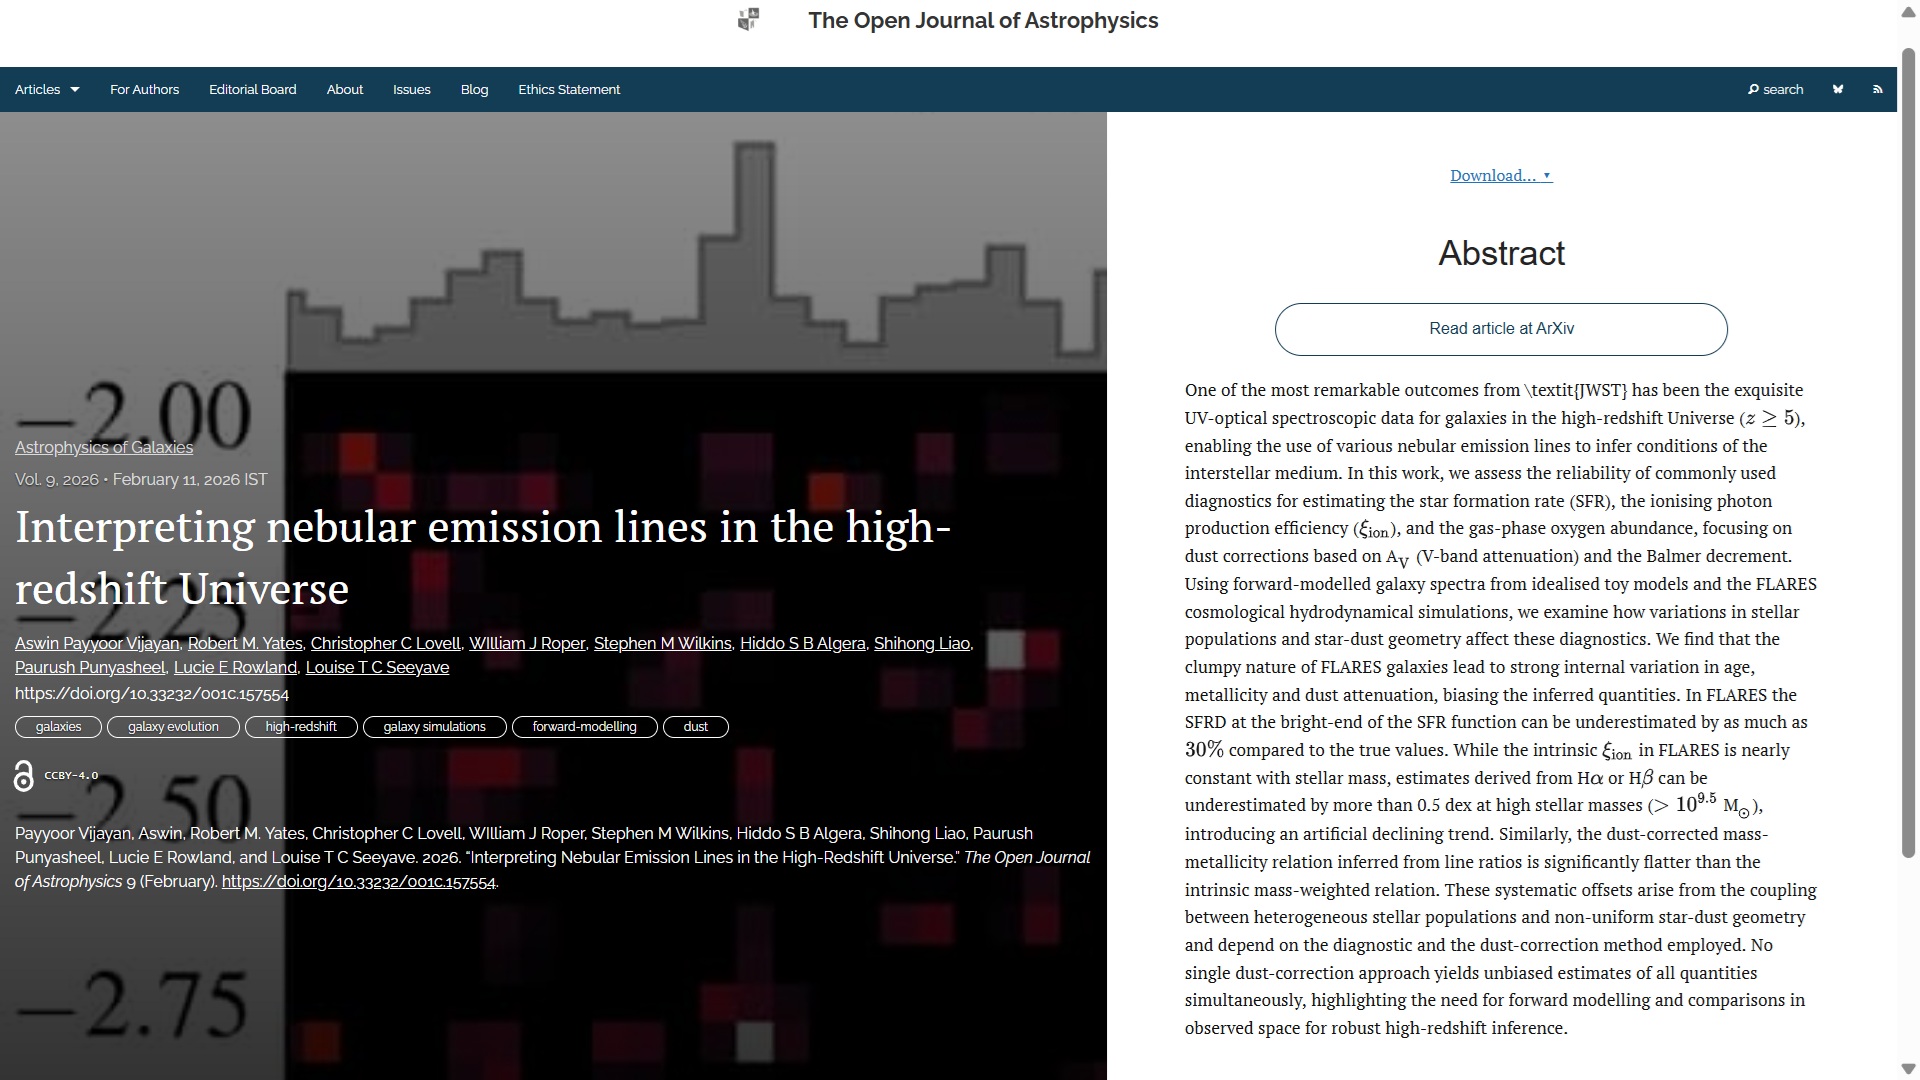
The official version can be found on arXiv here and the Fediverse announcement is here:
The fourth paper this week, also published on Wednesday 11th February, but in the folder Instrumentation and Methods for Astrophysics is “Derivative-Aligned Anticipation of Forbush Decreases from Entropy and Fractal Markers” by Juan D. Perez-Navarro & David Sierra Porta (Universidad Tecnológica de Bolívar, Colombia). The paper presents a feature-based framework for predicting Forbush decreases, i.e. rapid, temporary drops in galactic cosmic ray (GCR) intensity (up to tens of percent) caused by solar wind disturbances, typically Coronal Mass Ejections (CMEs) or high-speed streams from coronal holes, in neutron-monitor records using various computational methods. The approach is reproducible, operates on native station units, and is stable.
Here is the overlay:
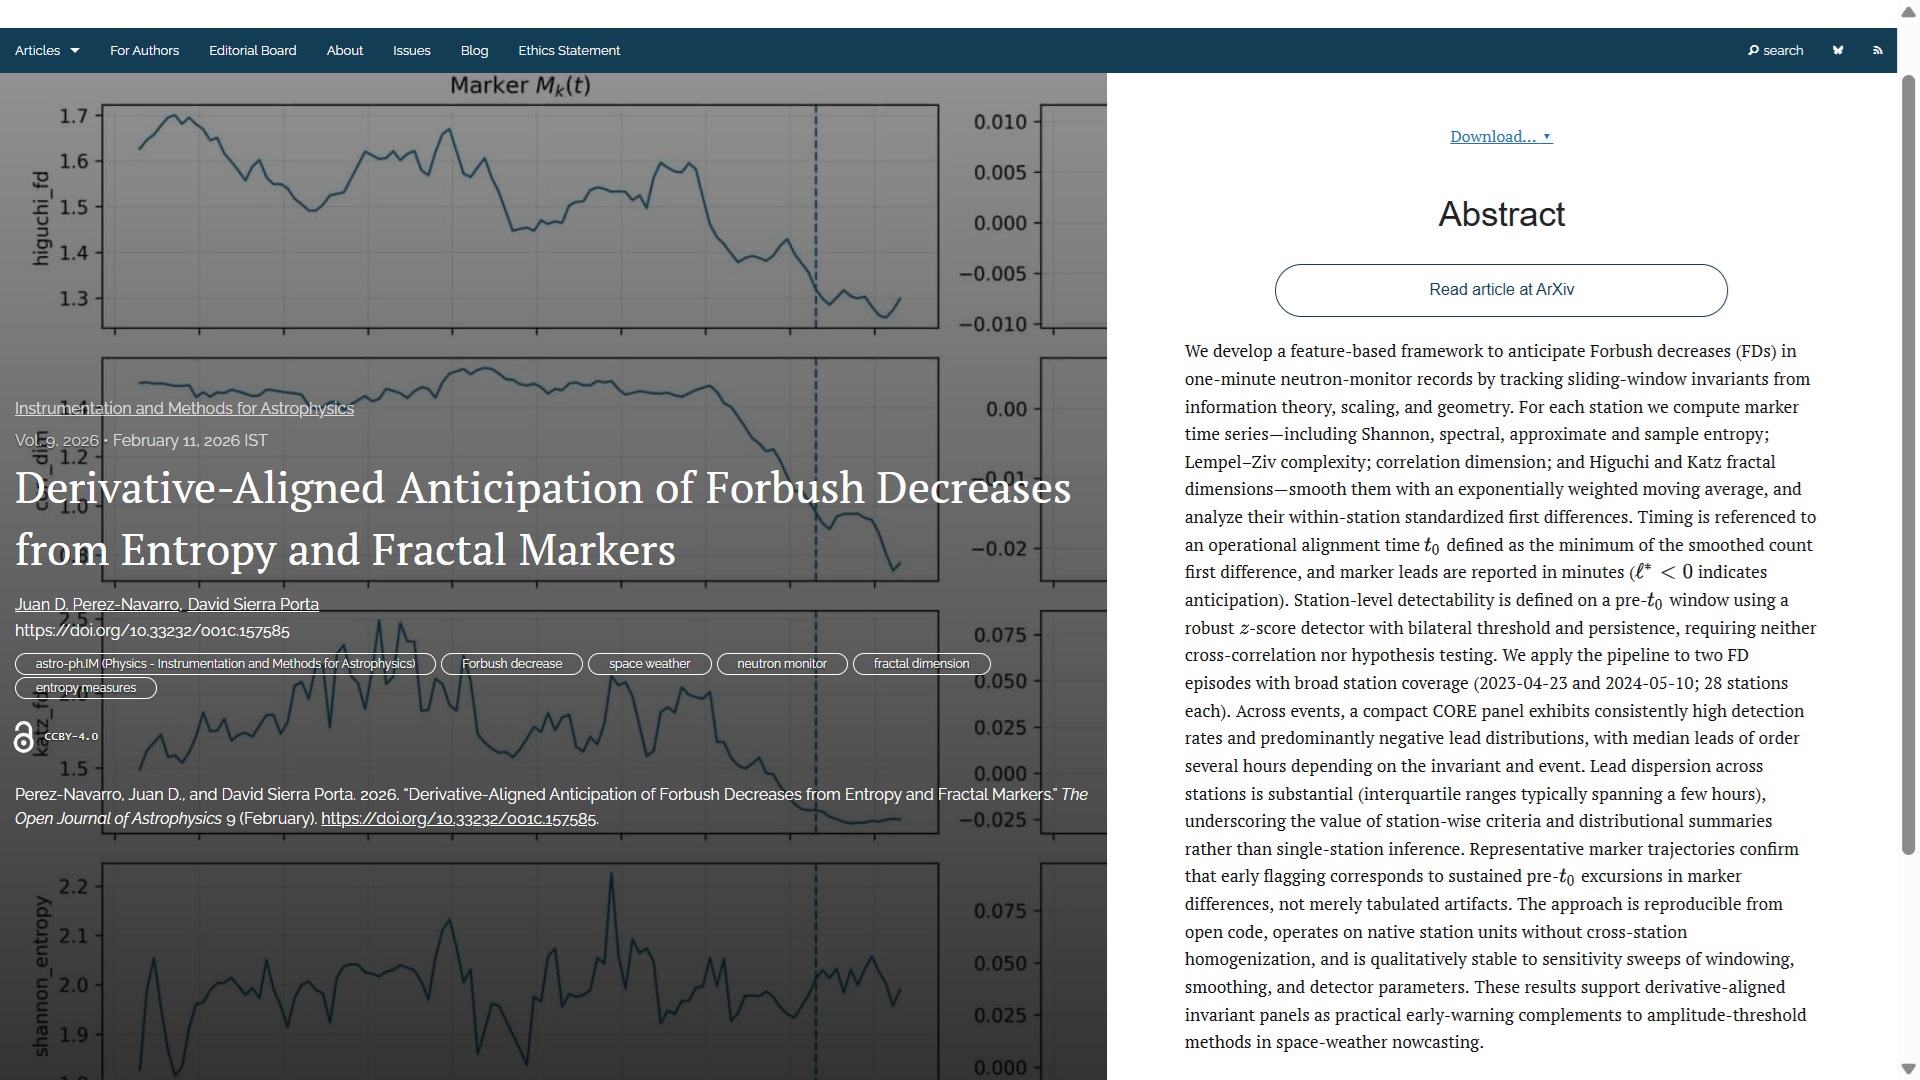
The official version can be found on arXiv here and the Fediverse announcement is here:
The fifth paper, the penultimate for this week, is “Supermassive black hole growth from stellar binary encounters” by Aubrey L Jones and Benjamin C Bromley (University of Utah, USA). This paper explores the growth of supermassive black holes (SMBHs) through stellar accretion via the Hill’s mechanism, predicting capture rates and identifying potential growth drivers in 91 galaxies. It was published on Thursday 11th February 2026 in the folder Astrophysics of Galaxies.
The overlay is here:
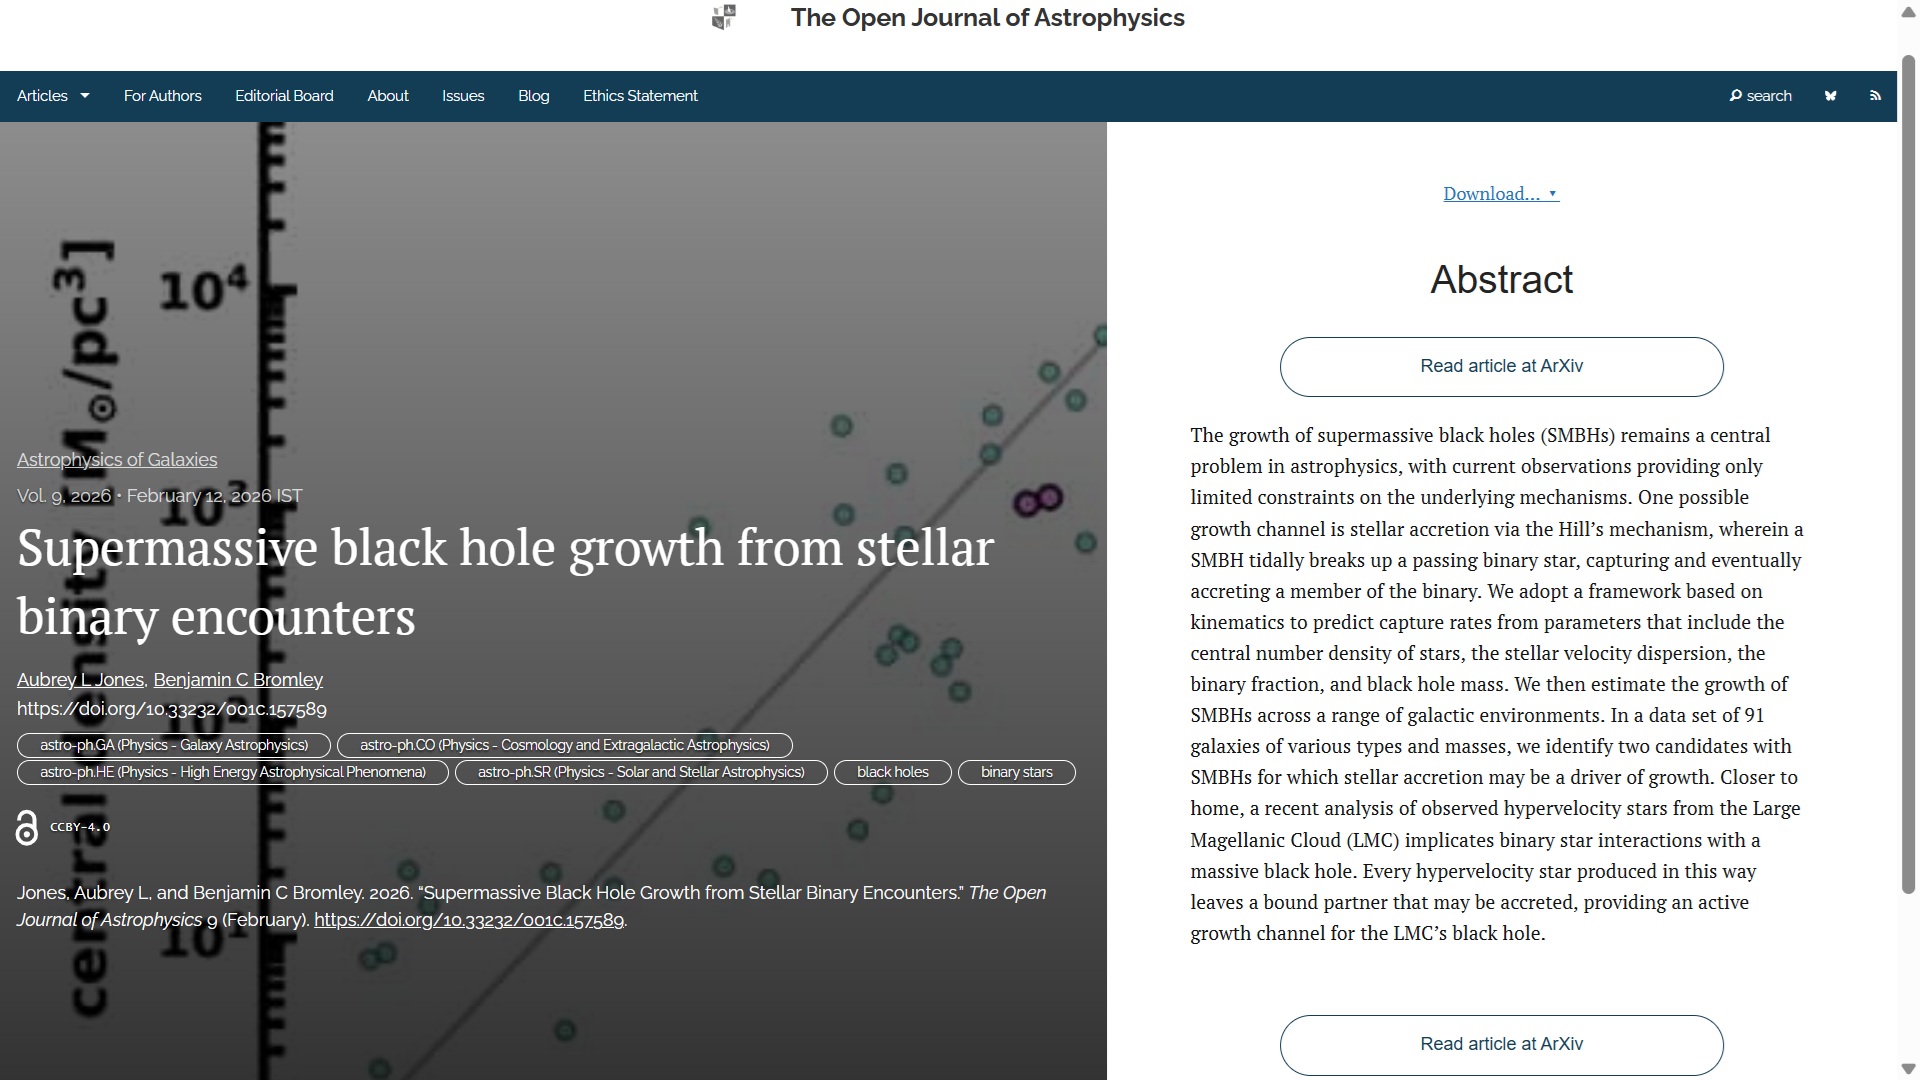
The accepted version can be found on arXiv here, and the fediverse announcement is here:
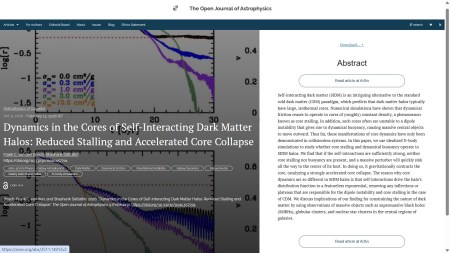
Finally for this week we have “Dynamics in the Cores of Self-Interacting Dark Matter Halos: Reduced Stalling and Accelerated Core Collapse” by Frank C. van den Bosch and Shashank Dattathri (Yale University, USA). This study uses simulations to explore core dynamics in self-interacting dark matter (SIDM) halos. Findings suggest strong self-interactions prevent core stalling and buoyancy, leading to accelerated core collapse. This was published yesterday, on Friday 13th February 2026, in the folder Astrophysics of Galaxies.
The overlay is here:
You can find the published version of the article here, and the Mastodon announcement is here:
And that concludes this week’s update. I will do another next Saturday.