Easter Emergency

Posted in Columbo on April 12, 2009 by telescoper

Well, this has to have been the most stressful Easter Sunday I’ve had in my whole life…

This morning, around 11.30 or so, my old cat Columbo (whose 15th birthday was on 31st March) suffered some kind of a seizure while I was sitting out in my garden reading the newspaper. It’s been warm and sunny over the holiday weekend so I’ve been trying to make the most of it, including having breakfast al fresco.

Columbo suddenly had a funny turn, cried out and then simultaneously evacuated bowels and bladder onto the garden path.  He staggered off into the house, alternately mewing and hissing, and proceeded to half-pace half-crawl around from room to room. Hoping he would settle down in due course, I just kept an eye on him and tried to let him find somewhere comfortable to recover from whatever bad thing had happened to him. He  didn’t seem to recognize me or the house he was in.

After about an hour of this, I gave up and called the emergency line and the vet. Such things always seem to happen during holidays when the vets are closed. Anyway, I managed to persuade the vet on the other end of the line that it was indeed an emergency, and rushed the sick moggy there in a taxi. The emergency vet arrived and opened up the clinic about ten minutes later.

Columbo hadn’t really improved in the meantime and he behaved very strangely in the vets, pacing around the examination table and sniffing everything repeatedly. The vet examined him thoroughly, including testing his eyes. It appeared that he had lost most of his vision, probably very suddenly, and although he wasn’t completely blind this could account for his disorientation and obvious discomfort and stress.

There could be a variety of causes of such a seizure for an old cat (stroke, toxic shock, neurological disease, etc) but the vet pronounced it unlikely to be directly connected to his diabetes as all the signs suggested a neurological problem. He had probably lost his faculties when whatever it was happened, and evidently lost control in  other ways too.

After lengthy consultations she (the vet) gave him a series of injections including antibiotics, an anti-inflammatory drug, and a sedative to try to calm him down a little.  She also gave me three diazepam tablets – which I initially thought were for me, as I was panicky too – in case he needed something later on to help him sleep. I was going to suggest that Mog-adon might be better but thought better of it.

It was clear that Columbo had experienced something that had completely deranged his mind, left him unable to see things properly, and put him into a state where he hadn’t the faintest idea where he was. The poor thing was obviously terribly frightened and confused. I think the vet knew that I knew how serious this could be and what I would have to do if the situation didn’t improve. I couldn’t allow him to suffer like that indefinitely.

But, the vet said, take him home, give him some rest, see if he’ll take food and bring him back tomorrow. We’ll see what state he’s in then.

So then I got him home. He carried on as before for about an hour and then either the sedative took effect or he was just knackered, so he climbed into his basket and went to sleep. I had some work to do so I left him on his own for a couple of hours, closing the kitchen door to give him some quiet. All the time I was thinking about soon having to make the decision to have him put down so I didn’t concentrate on my work at all well.

Eventually I went into the kitchen, where his basket is. I half-expected to find him dead. But as soon as I opened the door he climbed out of the basket and came directly to me. Clearly he was regaining some idea of where he was and could even see me. He purred when I reached down to stroke him. I went into the kitchen and he followed, still a bit groggy, but much better than before. I tried him with a bit of food and he wolfed it down quite happily before plodding off back to his basket. Not 100% by any means, but much better than the state he was in a few hours before.

So that’s where the story is so far. With  Columbo tucking in, I realized I hadn’t eaten a thing since breakfast so I’m warming something up now as I write this. I think I could do with a drink too.

For the time being, the emergency appears to be over, but we’ll see how he gets on at the vets tomorrow.

Easter Physics Quiz

Posted in Uncategorized with tags on April 10, 2009 by telescoper

Over the Easter holidays the newspapers seem to be full of quizzes and other distractions, so I thought I’d join in with a little quiz of my own.

So for a negligible prize can anyone point out the mathematical connection between these two pictures?


Answers via the comments box please.

Full Blast

Posted in Science Politics, The Universe and Stuff with tags , , , , , on April 9, 2009 by telescoper

Yesterday, Paolo Calisse and I were paid a visit by a reporter (Martin Shipton) and a photographer from Welsh newspaper The Western Mail who wanted to cover the sad story of Clover.

Paolo is heavily involved with Clover, but I was a bit hesitant about doing this because I’m not really part of the Clover team. Paolo suggested it might be an advantage that I wasn’t so directly involved as I might be able to give a more balanced view of the importance of the experiment than him. Anyway, the story came out today in the newspaper and is available online too.

DrThis is the picture they took of me and Paolo in the Clover lab, fiddling with the cryostat. I’ve already had my leg pulled enough about pretending to be an instrumentalist for the photograph so no jokes please…


In the same issue of the paper there is another feature about Cardiff’s astronomy research, concerning BLAST (Balloon-borne Large Aperture Submillimetre Telescope). This is a much happier story, as it marks the release of results from a highly successful science run from 2006. In the print version of the Western Mail the two stories were run on the same page, one above the other, making very effectively the point that cutting the funding of the Astronomy Instrumentation Group jeopardizes a great deal of world-leading research besides Clover itself. And when I say “world-leading” I mean it, whatever the RAE panel might have thought.

A deluge of articles about BLAST appeared on the arXiv today, one of which is now published in Nature. I thought I’d put up the abstracts here in order to draw attention to these results. The author lists contain many Cardiff authors and, as you’ll see, the results are both fascinating and wide-ranging. I’ve put links to the arXiv after each abstract:

Title: BLAST: Correlations in the Cosmic Far-Infrared Background at 250, 350, and 500 microns Reveal Clustering of Star-Forming Galaxies

Authors: Marco P. Viero, Peter A. R. Ade, James J. Bock, Edward L. Chapin, Mark J. Devlin, Matthew Griffin, Joshua O. Gundersen, Mark Halpern, Peter C. Hargrave, David H. Hughes, Jeff Klein, Carrie J. MacTavish, Gaelen Marsden, Peter G. Martin, Philip Mauskopf, Lorenzo Moncelsi, Mattia Negrello, Calvin B. Netterfield, Luca Olmi, Enzo Pascale, Guillaume Patanchon, Marie Rex, Douglas Scott, Christopher Semisch, Nicholas Thomas, Matthew D. P. Truch, Carole Tucker, Gregory S. Tucker, Donald V. Wiebe

We detect correlations in the cosmic far-infrared background due to the clustering of star-forming galaxies, in observations made with the Balloon-borne Large Aperture Submillimeter Telescope (BLAST), at 250, 350, and 500 microns. Since the star-forming galaxies which make up the far-infrared background are expected to trace the underlying dark matter in a biased way, measuring clustering in the far infrared background provides a way to relate star formation directly to structure formation. We test the plausibility of the result by fitting a simple halo model to the data. We derive an effective bias b_eff = 2.2 +/- 0.2, effective mass log(M_eff/M_sun) = 13.2 (+0.3/-0.8), and minimum mass log(M_min/M_sun) = 9.9 (+1.5/-1.7). This is the first robust clustering measurement at submillimeter wavelengths.

http://arxiv.org/abs/0904.1200

Title: Over half of the far-infrared background light comes from galaxies at z >= 1.2

Authors: Mark J. Devlin, Peter A. R. Ade, Itziar Aretxaga, James J. Bock, Edward L. Chapin, Matthew Griffin, Joshua O. Gundersen, Mark Halpern, Peter C. Hargrave, David H. Hughes, Jeff Klein, Gaelen Marsden, Peter G. Martin, Philip Mauskopf, Lorenzo Moncelsi, Calvin B. Netterfield, Henry Ngo, Luca Olmi, Enzo Pascale, Guillaume Patanchon, Marie Rex, Douglas Scott, Christopher Semisch, Nicholas Thomas, Matthew D. P. Truch, Carole Tucker, Gregory S. Tucker, Marco P. Viero, Donald V. Wiebe

Journal-ref: Nature, vol. 458, 737-739 (2009) DOI: 10.1038/nature07918

Submillimetre surveys during the past decade have discovered a population of luminous, high-redshift, dusty starburst galaxies. In the redshift range 1 <= z <= 4, these massive submillimetre galaxies go through a phase characterized by optically obscured star formation at rates several hundred times that in the local Universe. Half of the starlight from this highly energetic process is absorbed and thermally re-radiated by clouds of dust at temperatures near 30 K with spectral energy distributions peaking at 100 microns in the rest frame. At 1 <= z <= 4, the peak is redshifted to wavelengths between 200 and 500 microns. The cumulative effect of these galaxies is to yield extragalactic optical and far-infrared backgrounds with approximately equal energy densities. Since the initial detection of the far-infrared background (FIRB), higher-resolution experiments have sought to decompose this integrated radiation into the contributions from individual galaxies. Here we report the results of an extragalactic survey at 250, 350 and 500 microns. Combining our results at 500 microns with those at 24 microns, we determine that all of the FIRB comes from individual galaxies, with galaxies at z >= 1.2 accounting for 70 per cent of it. As expected, at the longest wavelengths the signal is dominated by ultraluminous galaxies at z > 1.

http://arxiv.org/abs/0904.1201

Title: The Balloon-borne Large Aperture Submillimeter Telescope (BLAST) 2006:
Calibration and Flight Performance

Authors: Matthew D. P. Truch, Peter A. R. Ade, James J. Bock, Edward L. Chapin, Mark J. Devlin, Simon R. Dicker, Matthew Griffin, Joshua O. Gundersen, Mark Halpern, Peter C. Hargrave, David H. Hughes, Jeff Klein, Gaelen Marsden, Peter G. Martin, Philip Mauskopf, Lorenzo Moncelsi, Calvin B. Netterfield, Luca Olmi, Enzo Pascale, Guillaume Patanchon, Marie Rex, Douglas Scott, Christopher Semisch, Nicholas E. Thomas, Carole Tucker, Gregory S. Tucker, Marco P. Viero, Donald V. Wiebe

The Balloon-borne Large Aperture Submillimeter Telescope (BLAST) operated successfully during a 250-hour flight over Antarctica in December 2006 (BLAST06). As part of the calibration and pointing procedures, the red hypergiant star VY CMa was observed and used as the primary calibrator. Details of the overall BLAST06 calibration procedure are discussed. The 1-sigma absolute calibration is accurate to 10, 12, and 13% at the 250, 350, and 500 micron bands, respectively. The errors are highly correlated between bands
resulting in much lower error for the derived shape of the 250-500 micron continuum. The overall pointing error is <5″ rms for the 36, 42, and 60″ beams. The performance of the optics and pointing systems is discussed.

http://arxiv.org/abs/0904.1202

Title: A Bright Submillimeter Source in the Bullet Cluster (1E0657–56) Field Detected with BLAST

Authors: Marie Rex, Peter A. R. Ade, Itziar Aretxaga, James J. Bock, Edward L. Chapin, Mark J. Devlin, Simon R. Dicker, Matthew Griffin, Joshua O. Gundersen, Mark Halpern, Peter C. Hargrave, David H. Hughes, Jeff Klein, Gaelen Marsden, Peter G. Martin, Philip Mauskopf, Calvin B. Netterfield, Luca Olmi, Enzo Pascale, Guillaume Patanchon, Douglas Scott, Christopher Semisch, Nicholas Thomas, Matthew D. P. Truch, Carole Tucker, Gregory S. Tucker, Marco P. Viero, Donald V. Wiebe

We present the 250, 350, and 500 micron detection of bright submillimeter emission in the direction of the Bullet Cluster measured by the Balloon-borne Large-Aperture Submillimeter Telescope (BLAST). The 500 micron centroid is coincident with an AzTEC 1.1 millimeter detection at a position close to the peak lensing magnification produced by the cluster. However, the 250 micron and 350 micron emission is resolved and elongated, with centroid positions shifted toward the south of the AzTEC source and a differential shift between bands that cannot be explained by pointing uncertainties. We therefore conclude that the BLAST detection is contaminated by emission from foreground galaxies associated with the Bullet Cluster. The submillimeter redshift estimate based on 250-1100 micron photometry at the position of the AzTEC source is z_phot = 2.9 (+0.6/-0.3), consistent with the infrared color redshift estimation of the most likely Spitzer IRAC counterpart. These flux densities indicate an apparent far-infrared luminosity of L_FIR = 2E13 L_sun. When the amplification due to the gravitational lensing of the cluster is removed, the intrinsic far-infrared luminosity of the source is found to be L_FIR <= 1E12 L_sun, consistent with typical luminous infrared galaxies.

http://arxiv.org/abs/0904.1203

Title: Radio and mid-infrared identification of BLAST source counterparts in the Chandra Deep Field South

Authors: Simon Dye, Peter A. R. Ade, James J. Bock, Edward L. Chapin, Mark J. Devlin, James S. Dunlop, Stephen A. Eales, Matthew Griffin, Joshua O. Gundersen, Mark Halpern, Peter C. Hargrave, David H. Hughes, Jeff Klein, Gaelen Marsden, Philip Mauskopf, Lorenzo Moncelsi, Calvin B. Netterfield, Luca Olmi, Enzo Pascale, Guillaume Patanchon, Marie Rex, Douglas Scott, Christopher Semisch, Nicholas Thomas, Matthew D. P. Truch, Carole Tucker, Gregory S. Tucker, Marco P. Viero, Donald V. Wiebe

We have identified radio and/or mid-infrared counterparts to 198 out of 351 sources detected at >= 5 sigma over ~ 9 sq. degrees centered on the Chandra Deep Field South (CDFS) by the Balloon-borne Large Aperture Submillimeter Telescope (BLAST) at 250, 350, and 500 microns. We have matched 92 of these counterparts to optical sources with previously derived photometric redshifts and fitted SEDs to the BLAST fluxes and fluxes at 70 and 160 microns acquired with the Spitzer Space Telescope. In this way, we have constrained dust temperatures, total far-infrared/submillimeter luminosities and star formation rates for each source. Our findings show that the BLAST sources lie at significantly lower redshifts and have significantly lower rest-frame dust temperatures compared to submm sources detected in surveys conducted at 850 microns. We demonstrate that an apparent increase in dust temperature with redshift in our sample arises as a result of selection effects. This paper
constitutes the public release of the multi-wavelength catalog of >= 5 sigma BLAST sources contained within the full ~ 9 sq. degree survey area.

http://arxiv.org/abs/0904.1204

Title: BLAST: Resolving the Cosmic Submillimeter Background

Authors: Gaelen Marsden, Peter A. R. Ade, James J. Bock, Edward L. Chapin, Mark J. Devlin, Simon R. Dicker, Matthew Griffin, Joshua O. Gundersen, Mark Halpern, Peter C. Hargrave, David H. Hughes, Jeff Klein, Philip Mauskopf, Benjamin Magnelli, Lorenzo Moncelsi, Calvin B. Netterfield, Henry Ngo, Luca Olmi, Enzo Pascale, Guillaume Patanchon, Marie Rex, Douglas Scott, Christopher Semisch, Nicholas Thomas, Matthew D. P. Truch, Carole Tucker, Gregory S. Tucker, Marco P. Viero, Donald V. Wiebe

The Balloon-borne Large Aperture Submillimeter Telescope (BLAST) has made one square-degree, deep, confusion-limited maps at three different bands, centered on the Great Observatories Origins Deep Survey South field. By calculating the covariance of these maps with catalogs of 24 micron sources from the Far-Infrared Deep Extragalactic Legacy Survey (FIDEL), we have determined that the total submillimeter intensities are 8.60 +/- 0.59, 4.93 +/- 0.34, and 2.27 +/- 0.20 nW m^-2 sr^-1 at 250, 350, and 500 microns, respectively. These numbers are more precise than previous estimates of the cosmic infrared background (CIB) and are consistent with 24 micron-selected galaxies generating the full intensity of the CIB. We find that more than half of the CIB originates from sources at z >= 1.2. At all BLAST wavelengths, the relative intensity of high-z sources is higher for 24 micron-faint sources than it is for 24 micron-bright sources. Galaxies identified very broadly as AGN by their Spitzer Infrared Array Camera (IRAC) colors contribute 32-48% of the CIB, although X-ray-selected AGN contribute only 7%. BzK-selected galaxies are found to be brighter than typical 24 micron-selected galaxies in the BLAST bands, and contribute 32-42% of the CIB. These data provide high-precision constraints for models of the evolution of the number density and intensity of star-forming galaxies at high redshift.

http://arxiv.org/abs/0904.1205

Title: BLAST: A Far-Infrared Measurement of the History of Star Formation

Authors: Enzo Pascale, Peter A. R. Ade, James J. Bock, Edward L. Chapin, Mark J. Devlin, Simon Dye, Steve A. Eales, Matthew Griffin, Joshua O. Gundersen, Mark Halpern, Peter C. Hargrave, David H. Hughes, Jeff Klein, Gaelen Marsden, Philip Mauskopf, Lorenzo Moncelsi, Calvin B. Netterfield, Luca Olmi, Guillaume Patanchon, Marie Rex, Douglas Scott, Christopher Semisch, Nicholas Thomas, Matthew D. P. Truch, Carole Tucker, Gregory S. Tucker, Marco P. Viero, Donald V. Wiebe

We use measurements from the Balloon-borne Large Aperture Sub-millimeter Telescope (BLAST) at wavelengths spanning 250 to 500 microns, combined with data from the Spitzer Infrared telescope and ground-based optical surveys in GOODS-S, to determine the average star formation rate of the galaxies that comprise the cosmic infrared background (CIB) radiation from 70 to 500 microns, at redshifts 0 < z < 3. We find that different redshifts are preferentially probed at different wavelengths within this range, with most of the 70 micron background generated at z < ~1 and the 500 micron background generated at z >~1. The spectral coverage of BLAST and Spitzer in the region of the peak of the background at ~200 microns allows us to directly estimate the mean physical properties (temperature, bolometric luminosity and mass) of the dust in the galaxies responsible for contributing more than 80% of the CIB. By utilizing available redshift information we directly measure the evolution of the far infrared luminosity density and therefore the optically obscured star formation history up to redshift z ~3.

http://arxiv.org/abs/0904.1206

Title: BLAST: The Mass Function, Lifetimes, and Properties of Intermediate Mass Cores from a 50 Square Degree Submillimeter Galactic Survey in Vela (l = ~265)

Authors: Calvin. B. Netterfield, Peter A. R. Ade, James J. Bock, Edward L. Chapin, Mark J. Devlin, Matthew Griffin, Joshua O. Gundersen, Mark Halpern, Peter C. Hargrave, David H. Hughes, Jeff Klein, Gaelen Marsden, Peter G. Martin, Phillip Mauskopf, Luca Olmi, Enzo Pascale, Guillaume Patanchon, Marie Rex, Arabindo Roy, Douglas Scott, Christopher Semisch, Nicholas Thomas, Matthew D. P. Truch, Carole Tucker, Gregory S. Tucker, Marco P. Viero, Donald V. Wiebe

We present first results from an unbiased, 50 square degree submillimeter Galactic survey at 250, 350, and 500 microns from the 2006 flight of the Balloon-borne Large Aperture Submillimeter Telescope (BLAST). The map has resolution ranging from 36″ to 60″ in the three submillimeter bands spanning the thermal emission peak of cold starless cores. We determine the temperature, luminosity, and mass of more than a thousand compact sources in a range of evolutionary stages and an unbiased statistical characterization of the population. From comparison with C^18 O data, we find the dust opacity per gas mass, kappa/R = 0.16 cm^2/g at 250 microns, for cold clumps. We find that 2% of the mass of the molecular gas over this diverse region is in cores colder than 14 K, and that the mass function for these cold cores is consistent with a power law with index alpha = -3.22 +/- 0.14 over the mass range 14 M_sun < M < 80 M_sun, steeper than the Salpeter alpha = -2.35 initial massfunction for stars. Additionally, we infer a mass dependent cold core lifetime of tau(M) = 4E6 (M/20 M_sun)^-0.9 years — longer than what has been found in previous surveys of either low or high mass cores, and significantly longer than free fall or turbulent decay time scales. This implies some form of non-thermal support for cold cores during this early stage of star formation.

http://arxiv.org/abs/0904.1207

You can find a lot more detailed information on the dedicated BLAST website.

Tommy Flanagan

Posted in Jazz with tags , on April 8, 2009 by telescoper

I’ve only got time for a quick post today so I thought I’d put up a clip of someone I think is one of the most consistently enjoyable but underrated Jazz pianists of all time. He was probably best known as the long-time accompanist of Ella Fitzgerald but he also played on a number of really important Jazz albums with Sonny Rollins and John Coltrane, to name just two. He also loved to play within the classic Jazz trio format of piano, bass and drums as represented here.

This is the marvellous Tommy Flanagan playing yet another tune by the great Billy Strayhorn; this one’s called Raincheck.

Statistics Matters, Science Matters

Posted in Science Politics with tags , , on April 7, 2009 by telescoper

I thought I’d say something about why I think statistics and statistical reasoning are so important. Of course they are important in science. In fact, I think they lie at the very core of the scientific method, although I am still surprised how few practising scientists are comfortable even with statistical language. A more important problem is the popular impression that science is about facts and absolute truths. It isn’t. It’s a process. In order to advance it has to question itself.

Statistical reasoning also applies to many facets of everyday life, including business, commerce, transport, the media, and politics. Probability even plays a role in personal relationships, though mostly at a subconscious level. It is a feature of everyday life that science and technology are deeply embedded in every aspect of what we do each day. Science has given us greater levels of comfort, better health care, and a plethora of labour-saving devices. It has also given us unprecedented ability to destroy the environment and each other, whether through accident or design.

Civilized societies face rigorous challenges in this century. We must confront the threat of climate change and forthcoming energy crises. We must find better ways of resolving conflicts peacefully lest nuclear or conventional weapons lead us to global catastrophe. We must stop large-scale pollution or systematic destruction of the biosphere that nurtures us. And we must do all of these things without abandoning the many positive things that science has brought us. Abandoning science and rationality by retreating into religious or political fundamentalism would be a catastrophe for humanity.

Unfortunately, recent decades have seen a wholesale breakdown of trust between scientists and the public at large. This is due partly to the deliberate abuse of science for immoral purposes, and partly to the sheer carelessness with which various agencies have exploited scientific discoveries without proper evaluation of the risks involved. The abuse of statistical arguments have undoubtedly contributed to the suspicion with which many individuals view science.

There is an increasing alienation between scientists and the general public. Many fewer students enrol for courses in physics and chemistry than a a few decades ago. Fewer graduates mean fewer qualified science teachers in schools. This is a vicious cycle that threatens our future. It must be broken.

The danger is that the decreasing level of understanding of science in society means that knowledge (as well as its consequent power) becomes concentrated in the minds of a few individuals. This could have dire consequences for the future of our democracy. Even as things stand now, very few Members of Parliament are scientifically literate. How can we expect to control the application of science when the necessary understanding rests with an unelected “priesthood” that is hardly understood by, or represented in, our democratic institutions?

Very few journalists or television producers know enough about science to report sensibly on the latest discoveries or controversies. As a result, important matters that the public needs to know about do not appear at all in the media, or if they do it is in such a garbled fashion that they do more harm than good.

Years ago I used to listen to radio interviews with scientists on the Today programme on BBC Radio 4. I even did such an interview once. It is a deeply frustrating experience. The scientist usually starts by explaining what the discovery is about in the way a scientist should, with careful statements of what is assumed, how the data is interpreted, and what other possible interpretations might be and the likely sources of error. The interviewer then loses patience and asks for a yes or no answer. The scientist tries to continue, but is badgered. Either the interview ends as a row, or the scientist ends up stating a grossly oversimplified version of the story.

Some scientists offer the oversimplified version at the outset, of course, and these are the ones that contribute to the image of scientists as priests. Such individuals often believe in their theories in exactly the same way that some people believe religiously. Not with the conditional and possibly temporary belief that characterizes the scientific method, but with the unquestioning fervour of an unthinking zealot. This approach may pay off for the individual in the short term, in popular esteem and media recognition – but when it goes wrong it is science as a whole that suffers. When a result that has been proclaimed certain is later shown to be false, the result is widespread disillusionment.

The worst example of this tendency that I can think of is the constant use of the phrase “Mind of God” by theoretical physicists to describe fundamental theories. This is not only meaningless but also damaging. As scientists we should know better than to use it. Our theories do not represent absolute truths: they are just the best we can do with the available data and the limited powers of the human mind. We believe in our theories, but only to the extent that we need to accept working hypotheses in order to make progress. Our approach is pragmatic rather than idealistic. We should be humble and avoid making extravagant claims that can’t be justified either theoretically or experimentally.

The more that people get used to the image of “scientist as priest” the more dissatisfied they are with real science. Most of the questions asked of scientists simply can’t be answered with “yes” or “no”. This leaves many with the impression that science is very vague and subjective. The public also tend to lose faith in science when it is unable to come up with quick answers. Science is a process, a way of looking at problems not a list of ready-made answers to impossible problems. Of course it is sometimes vague, but I think it is vague in a rational way and that’s what makes it worthwhile. It is also the reason why science has led to so many objectively measurable advances in our understanding of the World.

I don’t have any easy answers to the question of how to cure this malaise, but do have a few suggestions. It would be easy for a scientist such as myself to blame everything on the media and the education system, but in fact I think the responsibility lies mainly with ourselves. We are usually so obsessed with our own research, and the need to publish specialist papers by the lorry-load in order to advance our own careers that we usually spend very little time explaining what we do to the public or why.

I think every working scientist in the country should be required to spend at least 10% of their time working in schools or with the general media on “outreach”, including writing blogs like this. People in my field – astronomers and cosmologists – do this quite a lot, but these are areas where the public has some empathy with what we do. If only biologists, chemists, nuclear physicists and the rest were viewed in such a friendly light. Doing this sort of thing is not easy, especially when it comes to saying something on the radio that the interviewer does not want to hear. Media training for scientists has been a welcome recent innovation for some branches of science, but most of my colleagues have never had any help at all in this direction.

The second thing that must be done is to improve the dire state of science education in schools. Over the last two decades the national curriculum for British schools has been dumbed down to the point of absurdity. Pupils that leave school at 18 having taken “Advanced Level” physics do so with no useful knowledge of physics at all, even if they have obtained the highest grade. I do not at all blame the students for this; they can only do what they are asked to do. It’s all the fault of the educationalists, who have done the best they can for a long time to convince our young people that science is too hard for them. Science can be difficult, of course, and not everyone will be able to make a career out of it. But that doesn’t mean that it should not be taught properly to those that can take it in. If some students find it is not for them, then so be it. I always wanted to be a musician, but never had the talent for it.

I realise I must sound very gloomy about this, but I do think there are good prospects that the gap between science and society may gradually be healed. The fact that the public distrust scientists leads many of them to question us, which is a very good thing. They should question us and we should be prepared to answer them. If they ask us why, we should be prepared to give reasons. If enough scientists engage in this process then what will emerge is and understanding of the enduring value of science. I don’t just mean through the DVD players and computer games science has given us, but through its cultural impact. It is part of human nature to question our place in the Universe, so science is part of what we are. It gives us purpose. But it also shows us a way of living our lives. Except for a few individuals, the scientific community is tolerant, open, internationally-minded, and imbued with a philosophy of cooperation. It values reason and looks to the future rather than the past. Like anyone else, scientists will always make mistakes, but we can always learn from them. The logic of science may not be infallible, but it’s probably the best logic there is in a world so filled with uncertainty.

Post Mortem

Posted in Science Politics with tags , , , , on April 6, 2009 by telescoper

Finally the full details of the Physics panel’s deliberations during the 2008 Research Assessment Exercise have been published in the form of sub-profiles, showing the breakdown of the overall scores into various components, including the rating attached to “outputs” (i.e. papers), “environment” and “esteem”; for the jargon see the RAE guidelines for submissions.

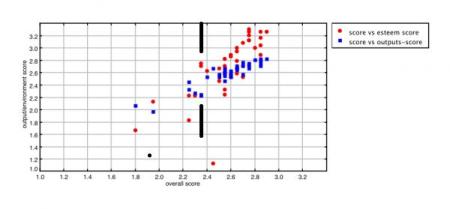
 I’ve blogged about the RAE results before: here, there, elsewhere, et cetera and passim. Andy Lawrence (e-astronomer) has now written a blog post about the latest publications from HEFCE  (commenting on the Cardiff situation with a generosity that contrasts with the offensive attitude displayed by one of my former colleagues).  Andy has also produced a graph which makes for very interesting reading:

rae_21

I’ve used my meagre graphical skills to indicate the location of Cardiff on the figure between the thick solid lines. Note the enormous gap between the panel’s assessment of our outputs (2.22) compared to the score for esteem (2.74).

I’ve mentioned before that apparently not a single one of the papers submitted by Cardiff’s excellent Astronomy Instrumentation Group was graded as 4* (world leading). Among the papers submitted by this group were several highly cited ones relating to an important Cosmic Microwave Background experiment called BOOMERANG. The panel probably judged that Cardiff hadn’t played a sufficiently prominent role in this collaboration to merit a 4*, which seems to be a completely perverse conclusion. The experiment wouldn’t have been possible at all without the Cardiff group.

Notwithstanding my disgruntlement at the particularly and peculiarly harsh assessment of Cardiff’s physics submission, there is also an indication of a more general problem. Notice how at the top right, a large number of departments has an output score seriously lagging their other score (by about 0.4 or more).

The counterexample to this trend is Loughborough, which has a very small but clearly good research activity in physics, and which scored 2.66 on its outputs but only 1.1 on environment. They are easily identified on the graph as an extreme outlier below the general trend.

Although there is no reason to expect a perfect correlation between the different elements of the overall assessment, it looks to me like the Physics panel decided to let the output score for the strong departments saturate at a level of about 2.8 whereas other panels were much more generous.

Why did they do this?

Answers on a postcard (or, better, via the comments box), please.

Shadows of Sylvia

Posted in Poetry with tags , , , , , , on April 5, 2009 by telescoper

The other day I decided to visit a few bookshops in Cardiff in order to spend the money I won in the TLS Crossword competition. It seemed only right to use it that way. These days I seem to buying poetry books more often than anything else. I’m not sure what that means.

I treated myself to the collected poems of Derek Walcott, whose work I have never really looked at before. He hails from St Lucia in the West Indies, and won the Nobel Prize for literature in 1992. His poems are truly wonderful, full of allusions to classical history and mythology, but with a distinctive Caribbean flavour all his own.  Definitely money well spent.

One of the other books I bought was a collection of peoms by Sylvia Plath, called The Colossus. This is one of those smart editions from Faber & Faber that are just the right size to fit into your pocket for a long journey on train or plane. I have had Ariel for some time, and have been meaning to read more of her verse for a long time but somehow never got around to it.

The only two things that most people are likely to know about Sylvia Plath are (1) that she was married to another poet, Ted Hughes , and (2) that she killed herself in 1963 by putting her head in a gas oven. The manner of her death endowed her with a cult status, which was further amplified when the collection called Ariel was eventually published after her death. In fact The Colossus was the only collection of her poems that was published during her life.

Although it’s a very banal way to put it, Sylvia Plath led a troubled life. She had a history of mental illness and nervous breakdown. Her poems are mostly of a confessional nature, unsurprisingly bleak, but often searingly intense and shot through with vivid imagery.  It’s not exactly easy reading, but if it’s catharsis you’re looking for, go no further. She’s even good for a quote or two about astronomy. How’s this, for example, from the poem Years (which didn’t make it into the collection of poems I blogged about a while ago):

O God, I am not like you
In your vacuous black,
Stars stuck all over, bright stupid confetti.
Eternity bores me,
I never wanted it.

One of the things that spurred me on to read a bit more of Sylvia Plath was the news  that her son, Nicholas Hughes, had committed suicide at the age of 46; as a young boy he was asleep in bed when his mother had ended her own life. There was also a very moving story in yesterday’s Guardian by writer Jeremy Gavron, whose mother Hannah Gavron also took her own life, in circumstances very similar to Sylvia Plath, in 1965.

Of course there’s been a lot of rather morbid stuff written about whether Sylvia Plath was somehow responsible for the eventual death of her son, whether the propensity to suicide may be inherited, whether it was all Ted Hughes’ fault, and so on. I think all this tells us is that one person can never really understand another’s pain and the greater the pain, the greater the incomprehension also.

A few years ago when I was external examiner, I was on a train from Nottingham to Cambridge going to an examiners meeting at the University of Cambridge. I had a window seat near the front of the carriage on the right hand side. Just outside Peterborough, the train was on a curved stretch of track so I could see the line in front of us. There was a level crossing with the barriers down and cars waiting either side. I could see quite clearly a female figure standing in the middle of the crossing but as the train got closer to her she vanished from view, obscured by the train. I heard the train’s warning signal and, seconds later, the driver shouted out “Oh No..”.

There was a horrible thump and the train lurched as it travelled over something that had gone underneath. The gruesome sound of a human body being sliced apart by metal wheels is something I’ll never forget. The train came to a halt, and the driver opened the door to his compartment. Icould see that blood had sprayed over the driver’s window. The poor driver looked like a ghost. He said that when he sounded the alarm the lady had turned and walked along the track towards the train. She looked directly into his eyes as the train hit her.

Eventually, perhaps an hour later, transport police and an ambulance arrived at the scene and a replacement driver was brought to us; train drivers can never carry on after such an event.  Some even have to quit the job. A police chaplain came too. The police and ambulance people collected the remains, made measurements, interviewed various people who had seen what happened and declared it a suicide. We moved to the next station, March, and got off onto the platform, the front of the train quickly hidden from us by a large piece of white canvas.

There had been time for the transport policemen to talk to the passengers who were all, like me, rattled by the experience. They (the police) had been through this all before, they said. That particular level crossing was  a place people came to specifically for that reason. Nobody could say why there and not somewhere else. Apparently it’s the same on the London Underground. Some stations have many suicides of people jumping in front of trains, others virtually none. Who can say why.

Suicides are not as rare as you might think. In the United Kingdom each year about one person in ten thousand takes their own life; we’re actually quite a long way down the league table for suicide rates. Men are about three times as likely to do it as women. My cousin Gary did it about five years ago. There are several per week just at railway stations or on railway lines across the United Kingdom.

When I was told these facts I was completely shocked. It has never crossed my mind to take my own life, especially not in a way that seems designed to cause other people suffering too.  The time comes all too soon anyway.

This intriguing video features Sylvia Plath reading probably her most famous poem Lady Lazarus.

Random Thoughts: Points and Poisson (d’Avril)

Posted in The Universe and Stuff with tags , , , on April 4, 2009 by telescoper

I’ve got a thing about randomness. For a start I don’t like the word, because it covers such a multitude of sins. People talk about there being randomness in nature when what they really mean is that they don’t know how to predict outcomes perfectly. That’s not quite the same thing as things being inherently unpredictable; statements about the nature of reality are ontological, whereas I think randomness is only a useful concept in an epistemological sense. It describes our lack of knowledge: just because we don’t know how to predict doesn’t mean that it can’t be predicted.

Nevertheless there are useful mathematical definitions of randomness and it is also (somtimes) useful to make mathematical models that display random behaviour in a well-defined sense, especially in situations where one has to take into account the effects of noise.

I thought it would be fun to illustrate one such model. In a point process, the random element is a “dot” that occurs at some location in time or space. Such processes occur in wide range of contexts: arrivals of buses at a bus stop, photons in a detector, darts on a dartboard, and so on.

Let us suppose that we think of such a process happening in time, although what follows can straightforwardly be generalised to things happening over an area (such a dartboard) or within some higher-dimensional region. It is also possible to invest the points with some other attributes; processes like this are sometimes called marked point processes, but I won’t discuss them here.

The “most” random way of constructing a simple point process is to assume that each event happens independently of every other event, and that there is a constant probability per unit time of an event happening. This type of process is called a Poisson process, after the French mathematician Siméon-Denis Poisson, who was born in 1781. He was one of the most creative and original physicists of all time: besides fundamental work on electrostatics and the theory of magnetism for which he is famous, he also built greatly upon Laplace’s work in probability theory. His principal result was to derive a formula giving the number of random events if the probability of each one is very low. The Poisson distribution, as it is now known and which I will come to shortly, is related to this original calculation; it was subsequently shown that this distribution amounts to a limiting of the binomial distribution. Just to add to the connections between probability theory and astronomy, it is worth mentioning that in 1833 Poisson wrote an important paper on the motion of the Moon.

In a finite interval of duration T the mean (or expected) number of events for a Poisson process will obviously just be proportional to the product of the rate per unit time and T itself; call this product l.
 
The full distribution is then

This gives the probability that a finite interval contains exactly x events. It can be neatly derived from the binomial distribution by dividing the interval into a very large number of very tiny pieces, each one of which becomes a Bernoulli trial. The probability of success (i.e. of an event occurring) in each trial is extremely small, but the number of trials becomes extremely large in such a way that the mean number of successes is l. In this limit the binomial distribution takes the form of the above expression. The variance of this distribution is interesting: it is alsol.  This means that the typical fluctuations within the interval are of order the square root of l on a mean level of l, so the fractional variation is of the famous “one over root n” form that is a useful estimate of the expected variation in point processes.  Indeed, it’s a useful rule-of-thumb for estimating likely fluctuation levels in a host of statistical situations.

If football were a Poisson process with a mean number of goals per game of, say, 2 then would expect must games to have 2 plus or minus 1.4 (the square root of 2)  goals, i.e. between about 0.6 and 3.4. That is actually not far from what is observed and the distribution of goals per game in football matches is actually quite close to a Poisson distribution.

This idea can be straightforwardly extended to higher dimensional processes. If points are scattered over an area with a constant probability per unit area then the mean number in a finite area will also be some number l and the same formula applies.

As a matter of fact I first learned about the Poisson distribution when I was at school, doing A-level mathematics (which in those days actually included some mathematics). The example used by the teacher to illustrate this particular bit of probability theory was a two-dimensional one from biology. The skin of a fish was divided into little squares of equal area, and the number of parasites found in each square was counted. A histogram of these numbers accurately follows the Poisson form. For years I laboured under the delusion that it was given this name because it was something to do with fish, but then I never was very quick on the uptake.

This is all very well, but point processes are not always of this Poisson form. Points can be clustered, so that having one point at a given position increases the conditional probability of having others nearby. For example, galaxies like those shown in the nice picture are distributed throughout space in a clustered pattern that is very far from the Poisson form. But it’s very difficult to tell from just looking at the picture. What is needed is a rigorous statistical analysis.

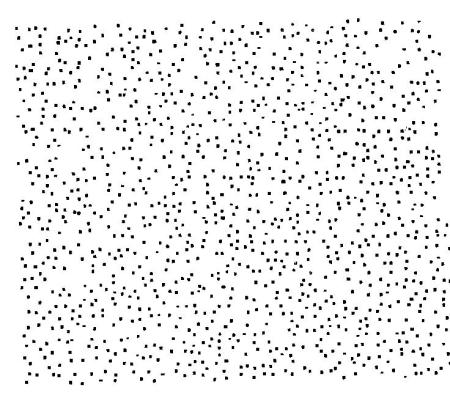
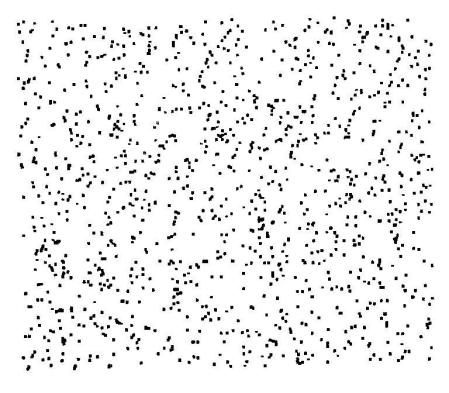
The statistical description of clustered point patterns is a fascinating subject, because it makes contact with the way in which our eyes and brain perceive pattern. I’ve spent a large part of my research career trying to figure out efficient ways of quantifying pattern in an objective way and I can tell you it’s not easy, especially when the data are prone to systematic errors and glitches. I can only touch on the subject here, but to see what I am talking about look at the two patterns below:


pointbpointa

You will have to take my word for it that one of these is a realization of a two-dimensional Poisson point process and the other contains correlations between the points. One therefore has a real pattern to it, and one is a realization of a completely unstructured random process.

I show this example in popular talks and get the audience to vote on which one is the random one. The vast majority usually think that the top  is the one that is random and the bottom one is the one with structure to it. It is not hard to see why. The top pattern is very smooth (what one would naively expect for a constant probability of finding a point at any position in the two-dimensional space) , whereas the bottom one seems to offer a profusion of linear, filamentary features and densely concentrated clusters.

In fact, it’s the bottom  picture that was generated by a Poisson process using a  Monte Carlo random number generator. All the structure that is visually apparent is imposed by our own sensory apparatus, which has evolved to be so good at discerning patterns that it finds them when they’re not even there!

The top  process is also generated by a Monte Carlo technique, but the algorithm is more complicated. In this case the presence of a point at some location suppresses the probability of having other points in the vicinity. Each event has a zone of avoidance around it; the points are therefore anticorrelated. The result of this is that the pattern is much smoother than a truly random process should be. In fact, this simulation has nothing to do with galaxy clustering really. The algorithm used to generate it was meant to mimic the behaviour of glow-worms which tend to eat each other if they get  too close. That’s why they spread themselves out in space more uniformly than in the random pattern.

Incidentally, I got both pictures from Stephen Jay Gould’s collection of essays Bully for Brontosaurus and used them, with appropriate credit and copyright permission, in my own book From Cosmos to Chaos. I forgot to say this in earlier versions of this post.

The tendency to find things that are not there is quite well known to astronomers. The constellations which we all recognize so easily are not physical associations of stars, but are just chance alignments on the sky of things at vastly different distances in space. That is not to say that they are random, but the pattern they form is not caused by direct correlations between the stars. Galaxies form real three-dimensional physical associations through their direct gravitational effect on one another.

People are actually pretty hopeless at understanding what “really” random processes look like, probably because the word random is used so often in very imprecise ways and they don’t know what it means in a specific context like this.  The point about random processes, even simpler ones like repeated tossing of a coin, is that coincidences happen much more frequently than one might suppose.

I suppose there is an evolutionary reason why our brains like to impose order on things in a general way. More specifically scientists often use perceived patterns in order to construct hypotheses. However these hypotheses must be tested objectively and often the initial impressions turn out to be figments of the imagination, like the canals on Mars.

Now, I think I’ll complain to wordpress about the widget that links pages to a “random blog post”.

I’m sure it’s not really random….

Neville Dickie

Posted in Jazz with tags , , on April 4, 2009 by telescoper

Just a quick post in response to a suggestion from a friend:I do requests on here, but only if they’re asked for.

Neville Dickie was born in County Durham in 1937 and did national service in the RAF around the same time as my Dad. He’s still going strong, playing lovely jazz mainly in the Harlem stride piano style of the 1920s with those infectiously bouncing left-hand tenths.

Here is he recorded in 2007 with Danny Coots on drums or, rather, drum. They’re playing a lovely tune by the great Jelly Roll Morton called Wolverine Blues.

The sound balance isn’t great but I think it’s a wonderful version of a classic bit of good time Jazz.

Take it away Mr Dickie!

Talking Planck

Posted in The Universe and Stuff with tags , , on April 3, 2009 by telescoper

Since the Planck mission is due to be launched very soon, I thought it would be nice to put this lecture by George Efstathiou here in order to give some background. It’s from a page of science talks about Planck.

George is the Professor of Astrophysics (1909) at the University of Cambridge. The 1909 isn’t when he was born, but when the Chair he holds was set up. I have a hundred-year-old Chair in my house too.
He is also the Director of the impressive Kavli Institute for Cosmology.
He’s a leading member of the Planck science team and is coordinating the UK effort that will be applied to analysing the data. He’s an FRS, citation millionaire, and general all-round clever clogs. He would cut an even more impressive figure were it not for the fact that he supports Arsenal.