It’s Saturday once more so time for another update of activity at the Open Journal of Astrophysics. Since the last update we have published a further six papers, bringing the number in Volume 9 (2026) to 24 and the total so far published by OJAp up to 472.
I will continue to include the posts made on our Mastodon account (on Fediscience) to encourage you to visit it. Mastodon is a really excellent service, and a more than adequate replacement for X/Twitter which nobody should be using; these announcement also show the DOI for each paper.
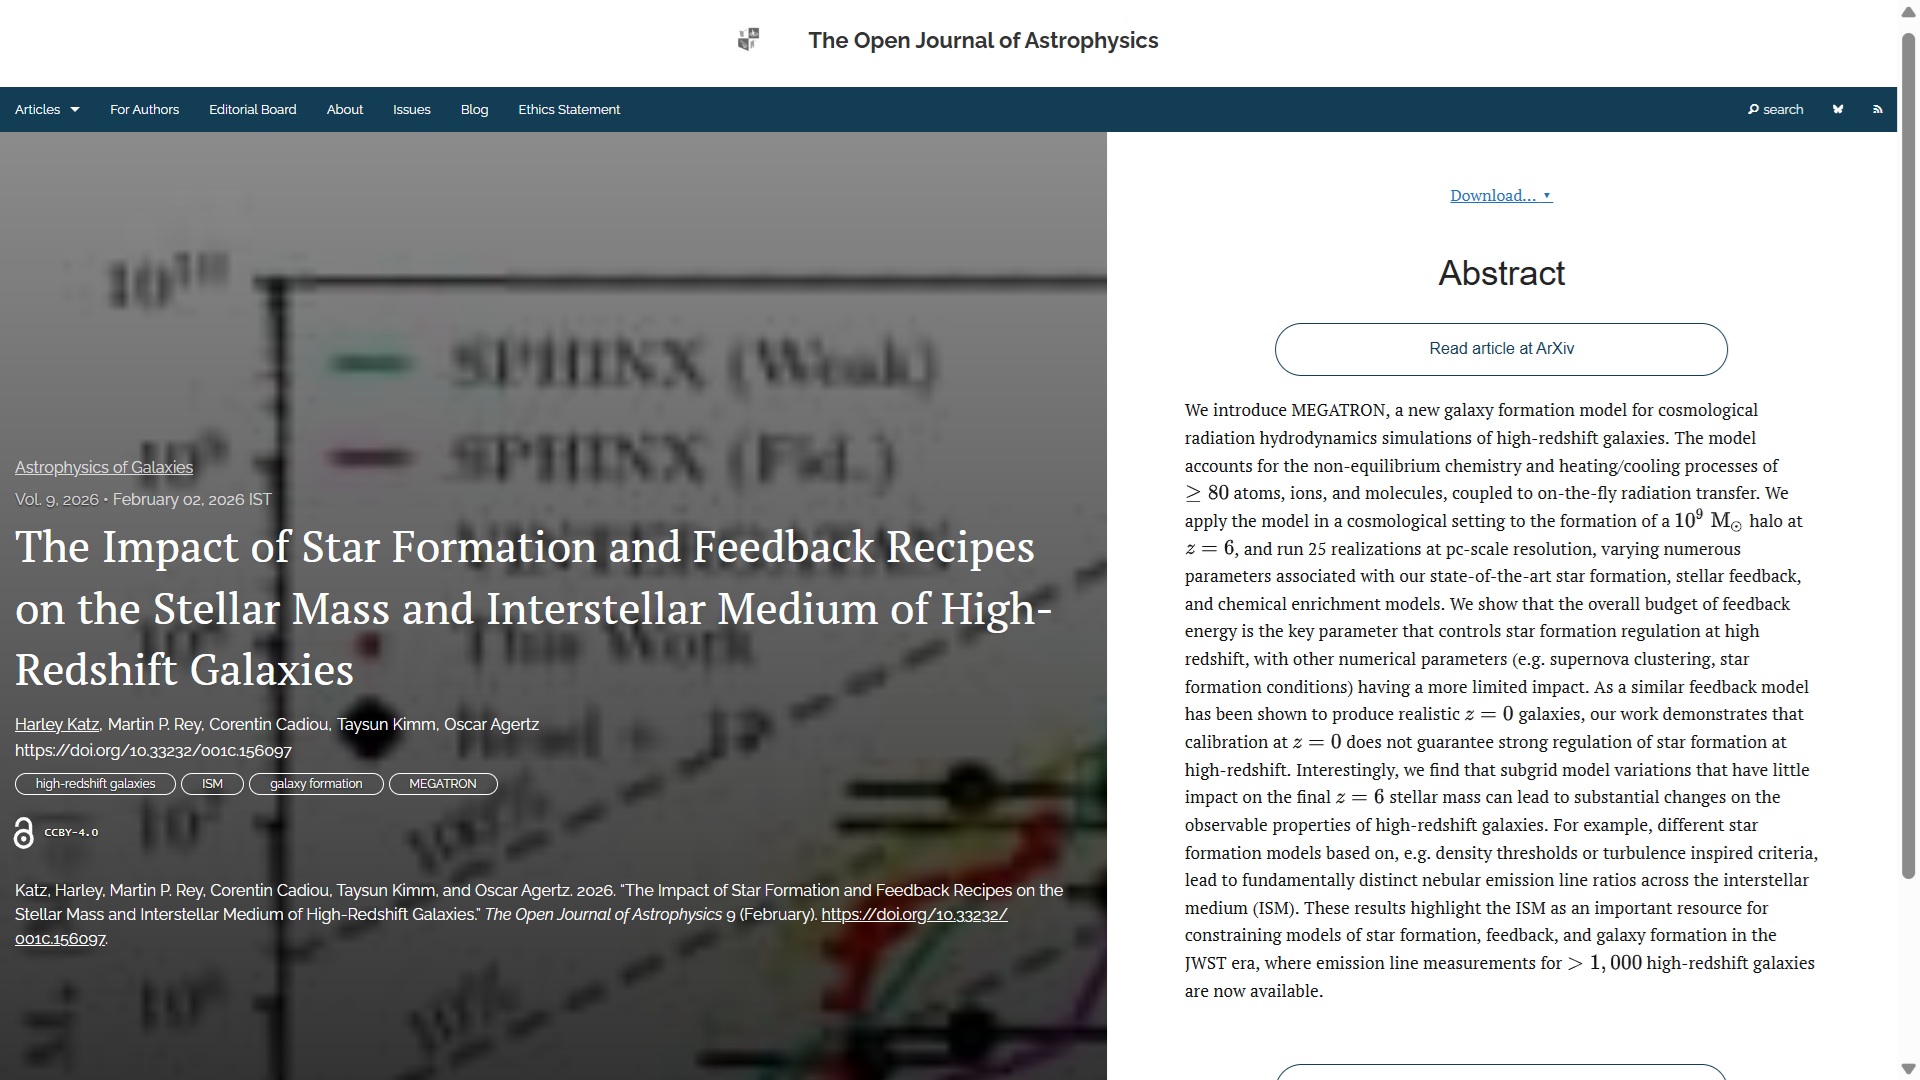
The first paper to report this week is “The Impact of Star Formation and Feedback Recipes on the Stellar Mass and Interstellar Medium of High-Redshift Galaxies” by Harley Katz (U. Chicago, USA), Martin P. Rey (U. Oxford, UK), Corentin Cadiou (Lund U., Sweden) Taysun Kimm (Yonsei U., Korea) and Oscar Agertz (Lund). This paper was published on Monday 2nd February 2026 in the folder Astrophysics of Galaxies. It introduces MEGATRON, a new model for galaxy formation simulations, highlighting that feedback energy controls star formation at high redshift and highlighting the importance of the interstellar medium.
The overlay is here:
You can find the officially accepted version on arXiv here and the announcement on Fediverse here:

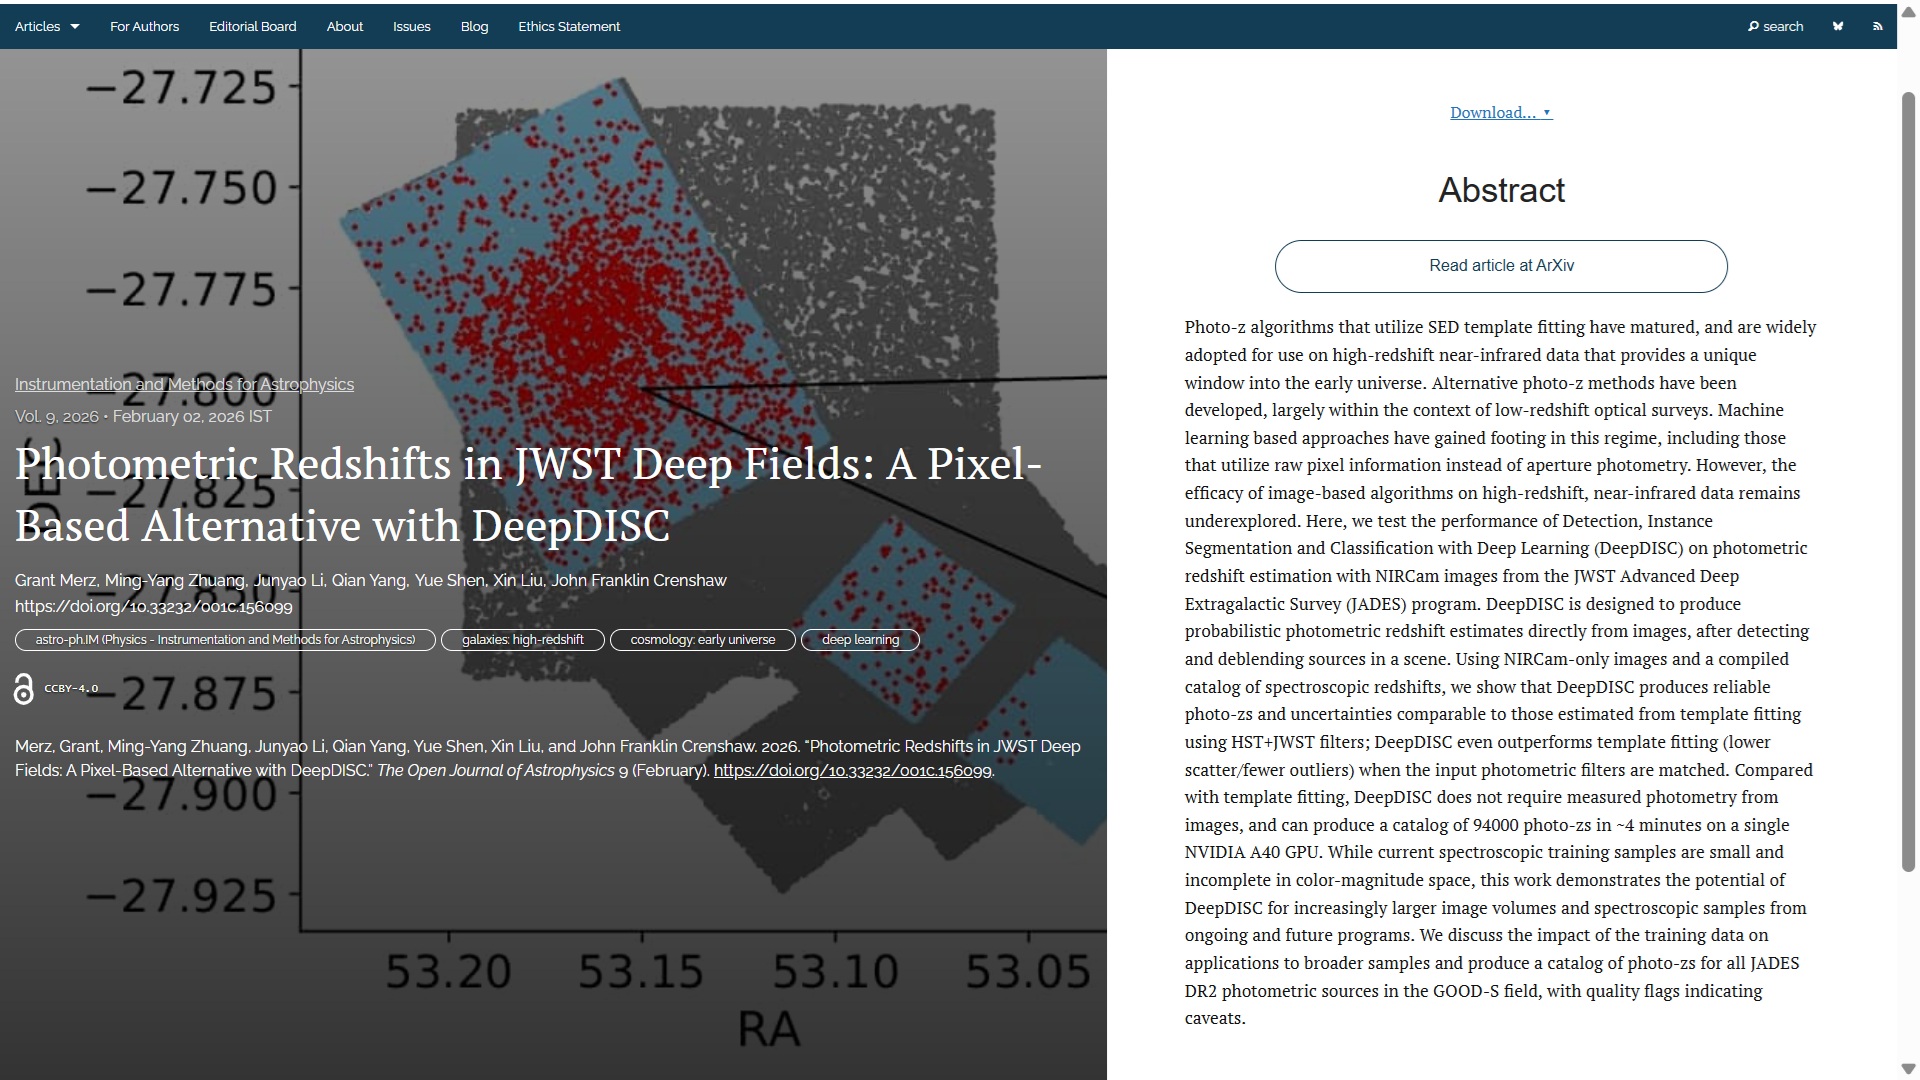
The second paper is “Photometric Redshifts in JWST Deep Fields: A Pixel-Based Alternative with DeepDISC” by Grant Merz (U. Illinois at Urbana-Champaign) and 6 others, all based in the USA. This paper was published on Monday February 2nd 2026 in the folder Instrumentation and Methods for Astrophysics. This paper explores the effectiveness of the DeepDISC machine learning algorithm in estimating photometric redshifts from near-infrared data, demonstrating its potential for larger image volumes and spectroscopic samples
The overlay for this one is here:
The official version of the paper can be found on arXiv here and the Fediverse announcement here:
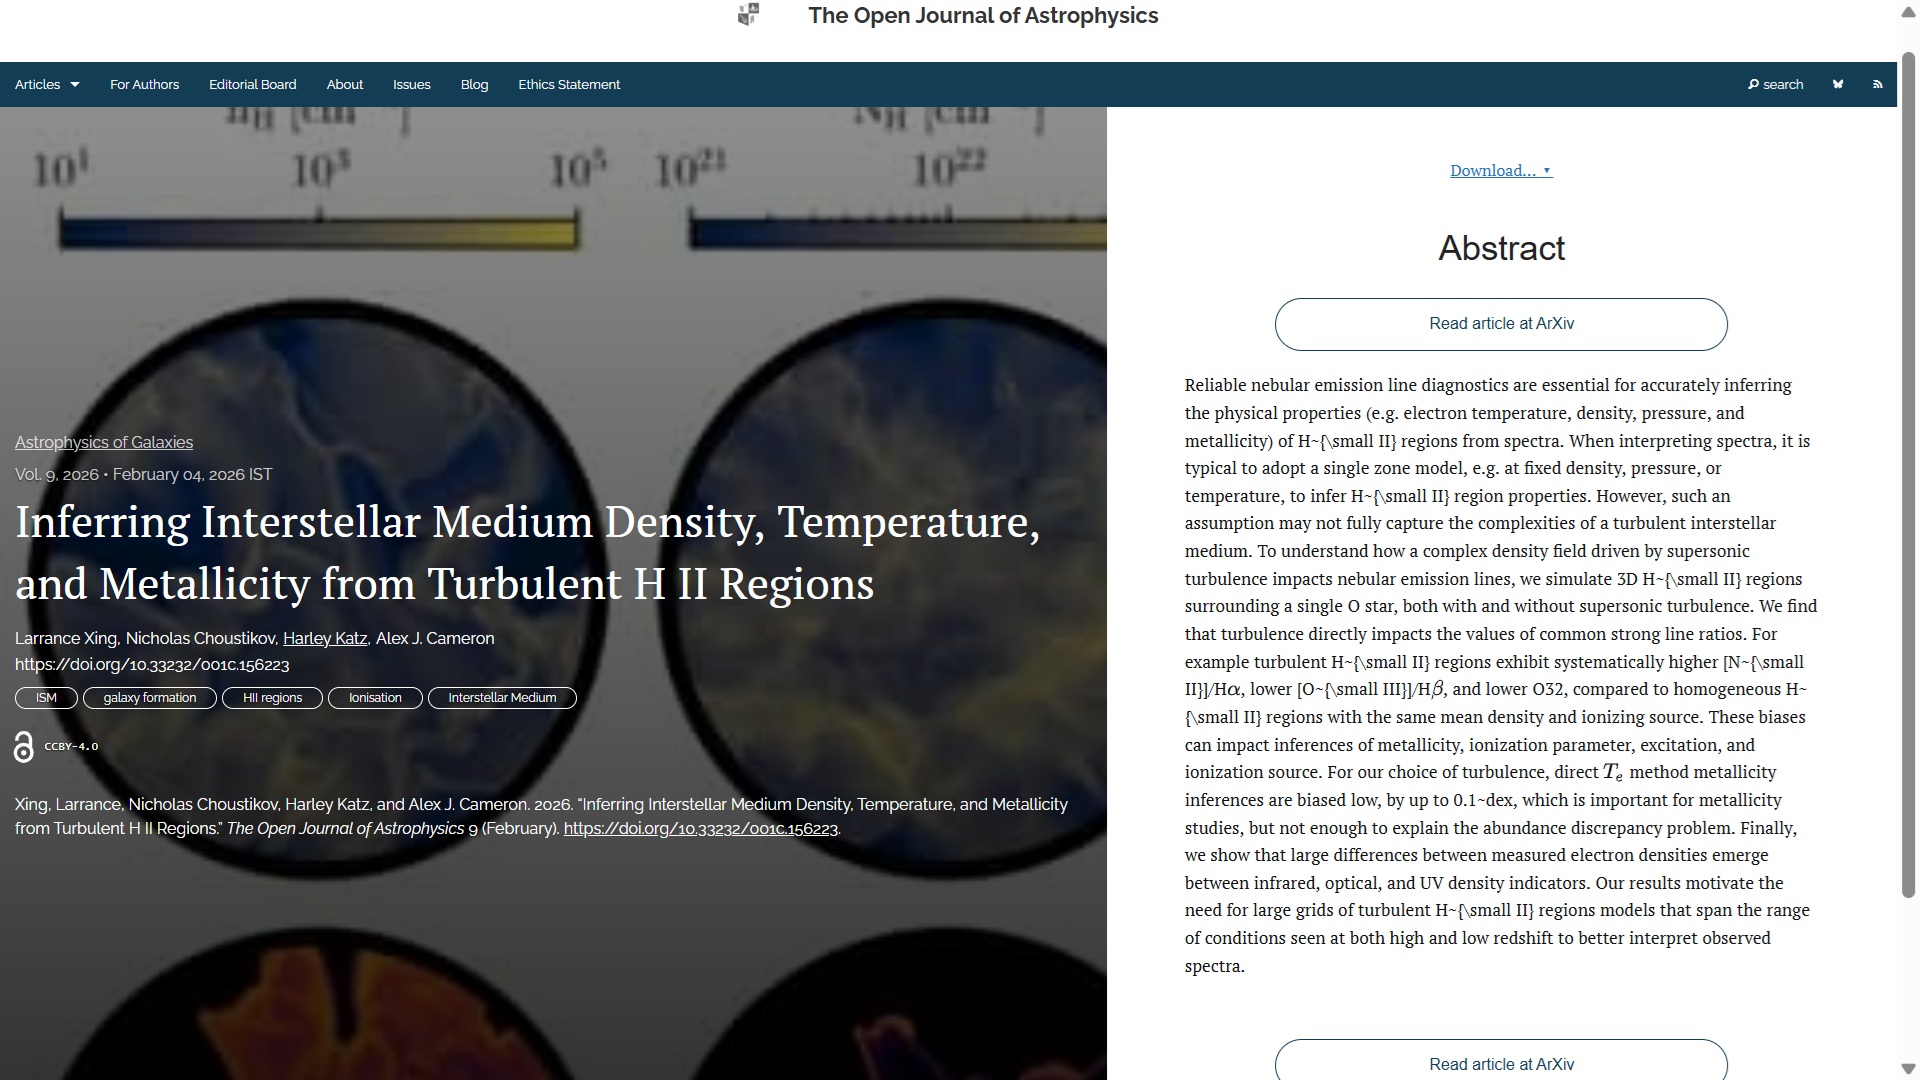
Next, published on Wednesday 4th February in the folder Astrophysics of Galaxies, is “Inferring Interstellar Medium Density, Temperature, and Metallicity from Turbulent H II Regions” by Larrance Xing (U. Chicago, USA), Nicholas Choustikov (U. Oxford, UK), Harley Katz (U. Chicago) and Alex J. Cameron (DAWN, Denmark). This paper argues that supersonic turbulenc affects the interpretation of H II region properties, potentially impacting inferred metallicity, ionization, and excitation from in nebular emission lines, motivating more extensive modelling.
The overlay is here:
The official version can be found on arXiv here and the Fediverse announcement is here:
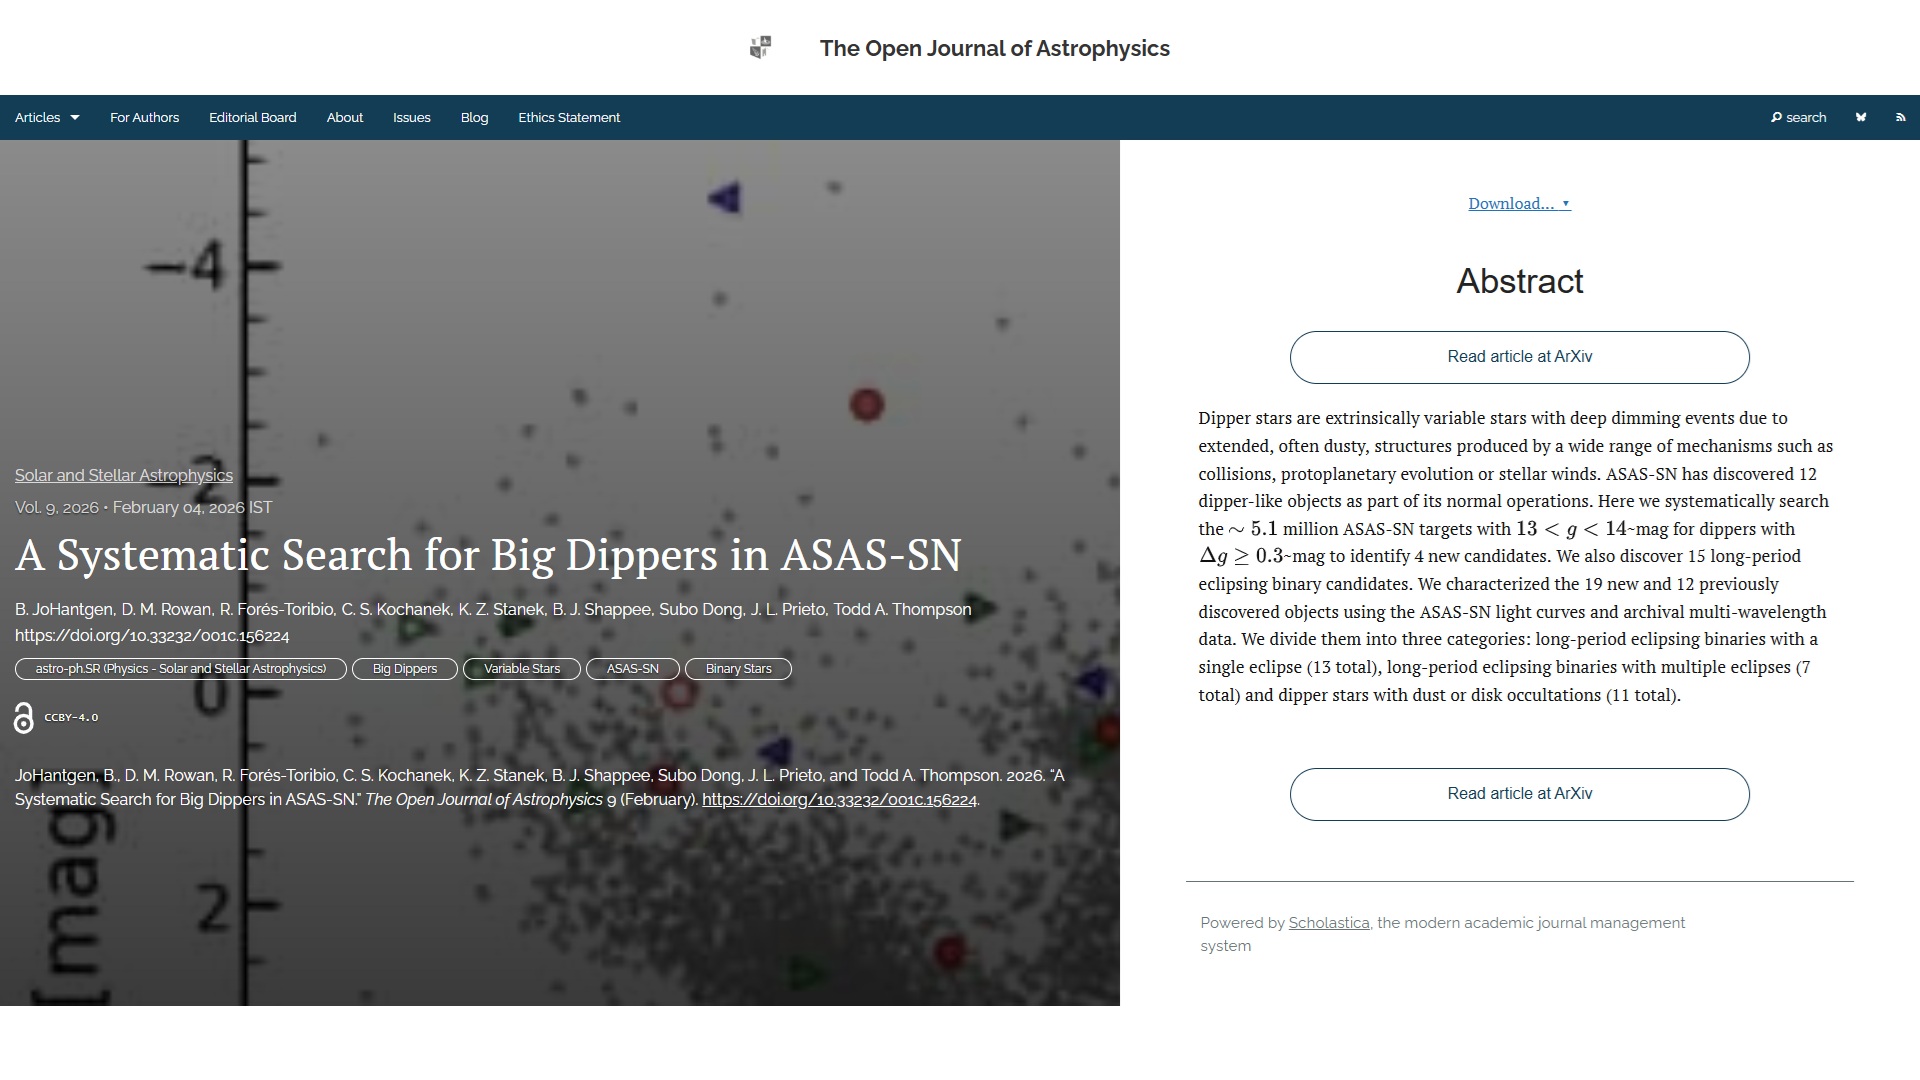
The fourth paper this week, also published on Wednesday 4th February, but in the folder Solar and Stellar Astrophysics, is “A Systematic Search for Big Dippers in ASAS-SN” by B. JoHantgen, D. M. Rowan, R. Forés-Toribio, C. S. Kochanek, & K. Z. Stanek (Ohio State University, USA), B. J. Shappee (U. Hawaii, USA), Subo Dong (Peking University), J. L. Prieto Universidad Diego Portales, Chile) and Todd A. Thompson (Ohio State). This study identifies 4 new dipper stars and 15 long-period eclipsing binary candidates using ASAS-SN light curves and multi-wavelength data, categorizing them based on their characteristics.
Here is the overlay:
The official version can be found on arXiv here and the Fediverse announcement is here:
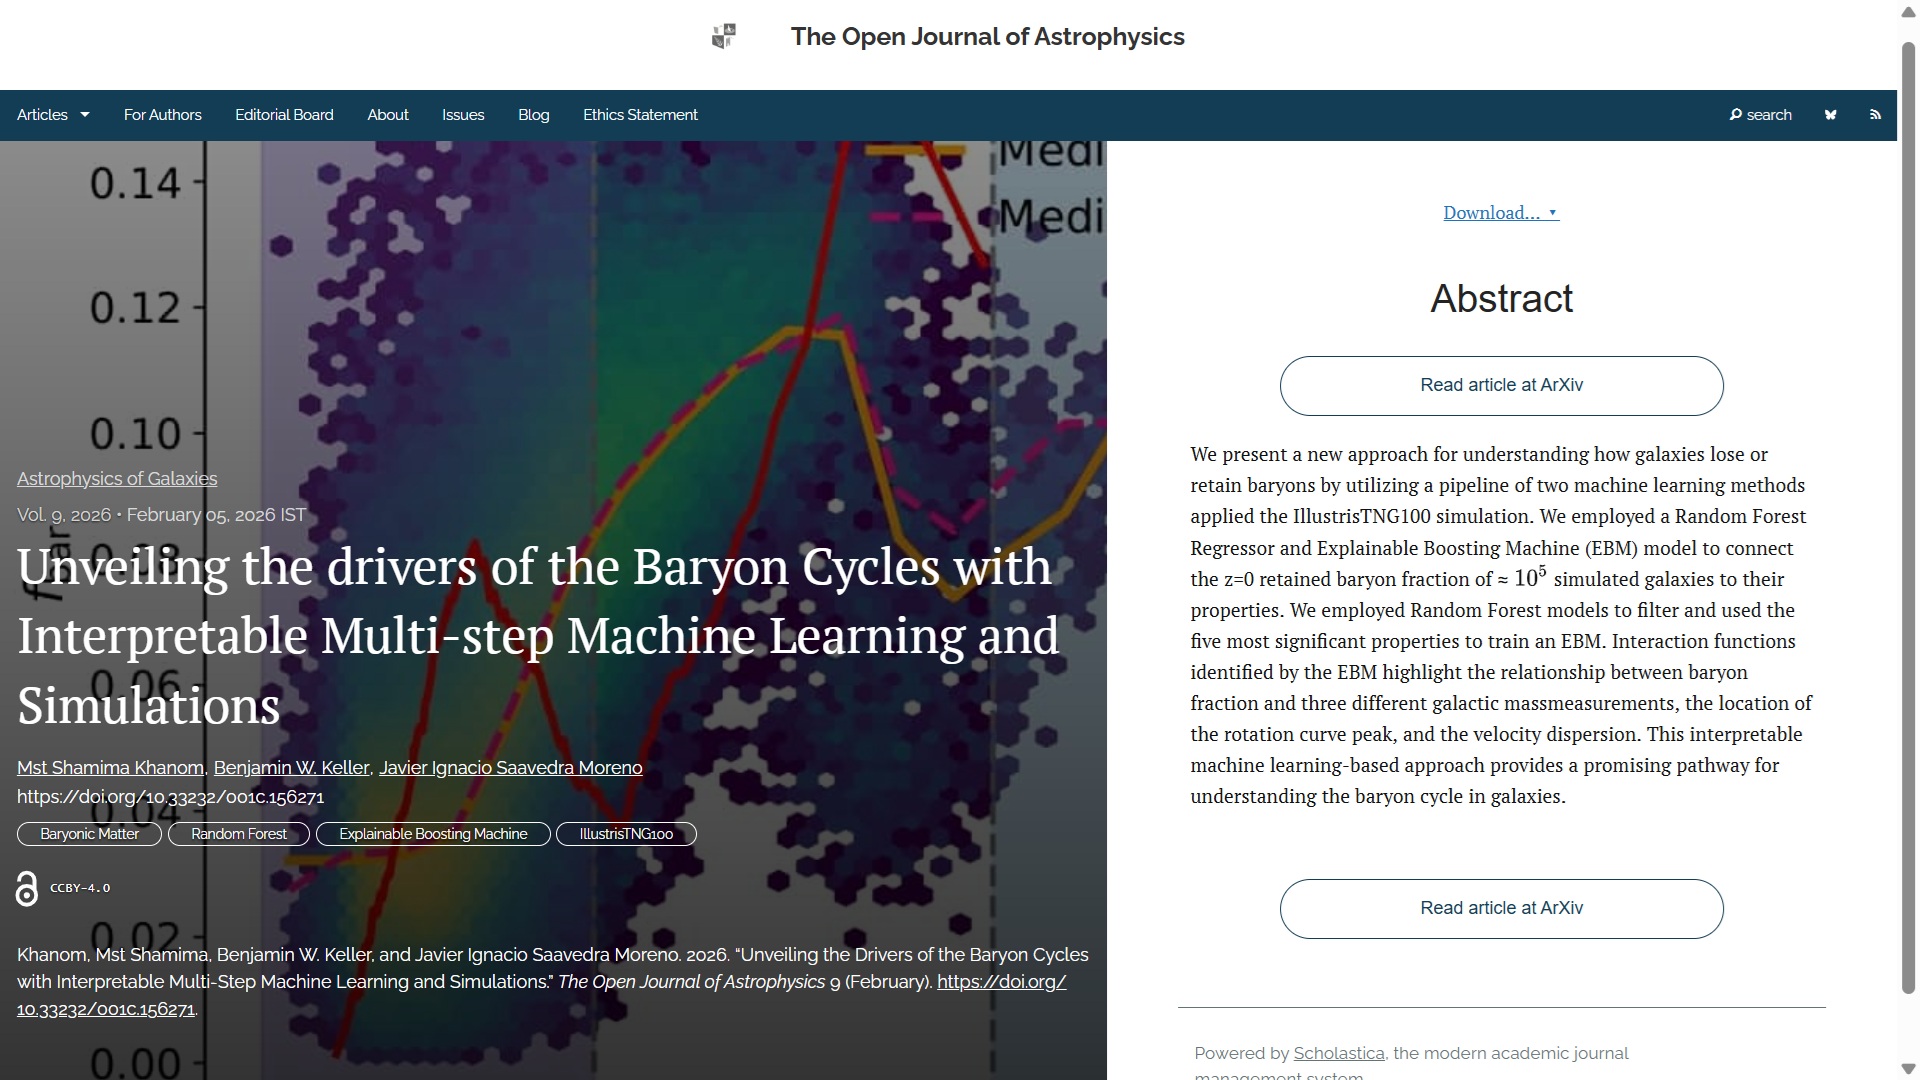
Fifth, and next to last this week we have “Unveiling the drivers of the Baryon Cycles with Interpretable Multi-step Machine Learning and Simulations” by Mst Shamima Khanom, Benjamin W. Keller and Javier Ignacio Saavedra Moreno (U. Memphis, USA). This paper was published on Thursday 5th February 2026 in the folder Astrophysics of Galaxies. This study uses machine learning methods to understand how galaxies lose or retain baryons, highlighting the relationship between baryon fraction and various galactic measurements.
The overlay is here:
The accepted version can be found on arXiv here, and the fediverse announcement is here:
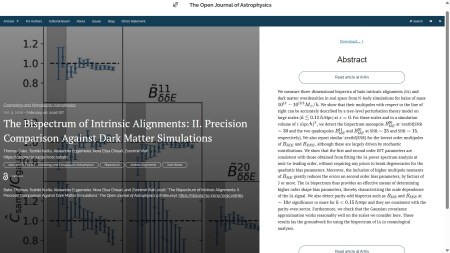
Finally for this week we have “The Bispectrum of Intrinsic Alignments: II. Precision Comparison Against Dark Matter Simulations” by Thomas Bakx (Utrecht U., Netherlands), Toshiki Kurita (MPA Garching, Germany), Alexander Eggemeier (U. Bonn, Germany), Nora Elisa Chisari (Utrecht) and Zvonimir Vlah (Ruđer Bošković Institute, Croatia). This paper was accepted in December, but publication got delayed by the Christmas effect so was published on February 6th 2026, in the folder Cosmology and Nongalactic Astrophysics. This study uses N-body simulations to accurately measure three-dimensional bispectra of halo intrinsic alignments and dark matter overdensities, providing a method to determine higher order shape bias parameters.
The overlay is here:
You can find the published version of the article here, and the Mastodon announcement is here:
And that concludes this week’s update. I will do another next Saturday.